Activities on the Intertubes for Veteran’s Day
Check out VoteVets.org.
How did the pollsters do for the 2016 election? That is a big and complicated question, because there are many different types and levels of polling done. In this post, I’ll look at the national polling in the Clinton—Trump race.
If my Twitter feed is any indication, the media seems hell-bent on the meme that “the polling was terrible” or “this is the end of polling.” But, as I show below, it wasn’t completely terrible for the national polling.
Yesterday, I heard a story on KUOW (I don’t remember the show, but perhaps All Things Considered or Here & Now) about the national polls. The story had things exactly wrong. They interviewed the director of the LA Times/USC poll (you know, the one that consistently had Trump leading Clinton), introducing it as “the one that got it right.” In fact, the LA Times/USC poll was the one that got it wrong.
Remember, national polls only tell us about the popular vote. And, as of this morning, Clinton leads in the popular vote. The LA Times/USC poll does use very interesting methods, asking their internet panel of respondents the probability of voting for each candidate. That is very cool (except for the internet panel part). But ultimately something about their poll led them to, almost uniquely, pick the wrong winner.
There are other criteria besides picking the right/wrong winner that are useful for evaluating the polls. A natural criterion is to ask which poll gets the percentages closest. That is what I have done. I’ve taken the national polling data as posted by Real Clear Politics and statistically evaluated “goodness of fit” between the poll result and the actual election outcome (as of this morning). The test I use is call a G-test of Goodness of Fit.
First I begin with the polls that did 2-way Clinton–Trump match-ups. Here are the polls from 31 Oct on, sorted newest to oldest (click for a larger image):
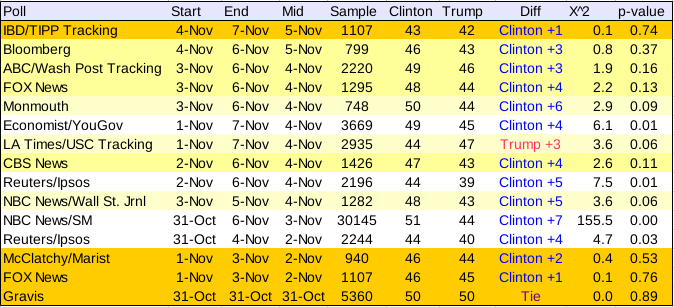
The “fit” of the poll is better for smaller numbers in the X^2 column, and the last column gives, essentially, the probability of observing deviations from the actual outcome at least this large given the sample size, assuming the poll was a true reflection of the outcome. I’ve highlighted the best fitting with darker colors (orange). The shades of yellow denote other polls that do not differ significantly. The worst fitting, those that differ significantly from the results, are shown in white.
The best polls are the four highlighted in orange, in order: The Gravis poll taken on 31 October, the FOX News poll taken from 1-3 Nov, IBD/TIPP Tracking poll taken 4-7 Nov, and the McClatchy poll taken 1-3 Nov. Odd that the three oldest polls are the closest.
The worst poll, by far, was the NBC News/Survey Monkey online tracking poll. This poll was way too optimistic for Clinton.
The LA Times/USC poll was middling. There is only a 6% probability of observing results this bad by chance. And, of course, the poll got the wrong winner.
But we see, using 4-way races, most of the national polls were, statistically, in the ball park. Ten of 14 weren’t had outcomes that were not statistically different from the actual election.
Here is the polling for the 4-way race. The extra two categories (Johnson and Stein) provides for more ways a poll can “deviate” from the observed election results, so the polls don’t fit as well overall. Many polls are heavily penalized for doing a lousy job in the Johnson or Stein percentages, even if the Trump and Clinton percentages are okay.
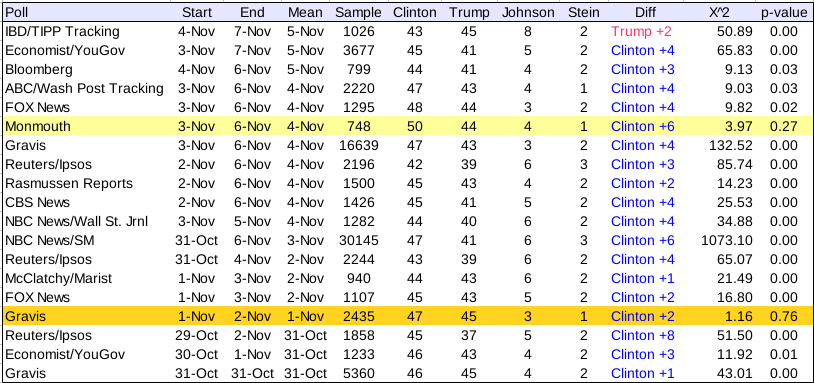
The best poll was by Gravis on 1-2 Nov. A later Gravis poll taken 3-6 Nov was actually one of the worst polls.
We see that, looking at a four-way race, the pollsters did not do that well. Only two of 19 polls did the results not differ significantly from the actual four-candidate distribution.
But what if we only consider the races that matter—Clinton and Trump? I’ve taken the four-way races and turned them into 2-way races. Mathematically, when doing the test, I “normalize” the results so that the sum of Clinton and Trump percentages are now 100%.
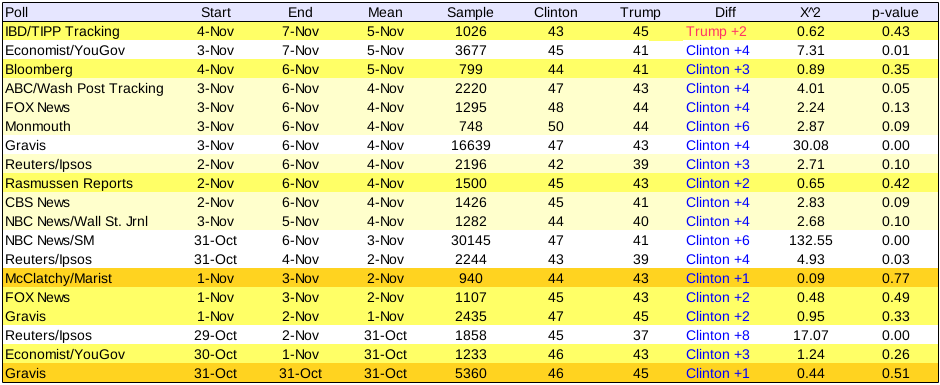
We see that for 14 of the 19 polls, the results did not differ from the actual outcome. Again, the worst poll, by far, was the NBC News/Survey Monkey online tracking poll. With such a large sample, they should have been much closer than they ended up being.
So, whatever you’ve heard, the national polls were generally not that far off in predicting two outcomes of the popular vote: The winner of Clinton v. Trump, and the relative proportions of Clinton v. Trump votes.
Jesus, guys. I love the American ideal, but damn did we not live up to it last night. I know Darryl has a lot of analysis, but all I have is hope.
The markets seem to know this is bad, but all I have is hope. Hope that we can figure something out at the state level if Obamacare gets repealed. Hope that we can survive it. Hope that we can prevent national stop and frisk. Hope that the bottom isn’t as far as we think it is. It’s scary. And it’s infinitely scarier if you’re not white. If you’re not a man. If you’re not Christian. America is trying to tell a lot of people that it’s not for them, but I still have hope because America still is for all Americans.
I don’t know what the future holds, but even now, when we’ve elected a man who looks like a fascist, and while there are checks and balances, the other branches are also controlled by Republicans, so who the fuck knows? Anyway, I’m much drunker writing this at 11:30 than I usually am just in general (and sorry (?) it’s so late). In conclusion, fuck, but don’t give up hope.
Here we go!
4:00: Georgia is too close to call! Trump takes Indiana and Kentucky. Hillary takes Vermont (thanks, Bros!)
4:01: South Carolina is slightly Trump leaning, but too close to call (really…not enough returns.)
4:03: Tim Scott (R), Pat Lehey (D) and Rand Paul (R) are going back to Washington D.C.
4:09: Dear MSNBC: Keep fucking Ghoul Giuliani off the fucking TV, for fuck sakes!
4:10: (p.s. if you could minimize Tweety’s time on the TV, we’d appreciate that, too.)
4:18: In my opinion, if Trump loses either Florida or North Carolina, he will lose.
4:50: SC has been called for Trump! Not a big surprise. I predicted 100% with BS polls and 77% chance without for Trump winning.
4:55: Shit’s gonna start happen’ soon.
4:45: North Carolina was called at 7:53pm PST in 2012. But, I believe a judge just extended the poll close time in some areas on account of erroneous announcements. Expect later call.
5:00: CALLS: FL, PA, NH, MO, ME, GA, NC, VA too early to call. IL, MA, CT, RI, DE, DC goes Clinton. MS, OK, AL, TN goes to Mr. Drumpf
5:03: Duckworth takes IL SEN!!!!!!!
5:05: The Duckworth win isn’t a surprise, but it is significant. Without this win, there is no way Dems would take the Senate. As it is, Dem control of the Senate is iffy.
5:09: Steve Kornacki, “…with Hillary Clinton cleaning up with Black voters in Florida….” Ummm…maybe rephrase that?
5:25: As I predicted, Young takes Indiana! That is a blow to Dem’s taking the Senate, but not unexpected given the recent polling.
5:30: Virginia has moved from “too early to call” to “too close to call”. Frankly, I don’t view that as a good sign.
SC/AL both called for Trump. No surprises.
Trump best: T+66
Expected: C+8
Clinton best: C+210https://t.co/gmUwTGqJr4— Election Graphs (@ElectionGraphs) November 9, 2016
5:44: Some networks call the House for the GOP. Probably true, but AP hasn’t called it yet.
5:45: Georgia is too close to call. Really?!? Georgia could go for Clinton?
5:46: On the other hand, Florida isn’t looking good for Clinton.
5:47: Clinton has a +7% lead in Ohio right now, but really the lead may not be representative.
I wonder if @DineshDSouza is working off any of his public service sentence tonight?
— Darryl Holman (@hominidviews) November 9, 2016
5:55: Hassan leads Ayotte in NH, but it is too close to call.
5:56: It took four days to get a call in Florida in 2012. It looks like FL is going to fuck with America again in 2016.
6:07: Clinton wins NY. Trump takes IN, ND.
6:08: Trump takes NE. Not sure about the NE CDs, but he probably takes them, too.
6:11: Trump takes Texas. Maybe President Hillary Clinton can arrange for Trump to become president of an independent nation called Texas.
6:16: I understand FAUX News has called Arizona for Sen. McCain. Could be.
6:18: Feingold is looking strong in WI.
It's pretty fucking embarrassing that this many states and this many Americans have been conned by a blithering dickhead.
— The Rude Pundit (@rudepundit) November 9, 2016
6:45: Frankly, it is pretty disappointing that the election is this close.
7:17: Virginia is going to Clinton. This is a “must win” for Clinton in case she loses NC and FL. She’ll need NV, WI, MI, and MN too…
7:20: The Donald takes OH. Totally expected, but an important development.
7:28: Okay…Two swing states called: OH Trump and VA Clinton.
7:36: PA is looking better. Clinton is up by 5%, although “calling” the state requires knowledge of what precincts have reported.
7:38: Are we having fun yet?
7:49: Looks like some media is callin NC for Trump…
7:52: Pennsylvania is looking good for Clinton. So here is the deal. If Trump wins FL and NC (as seems likely), Clinton needs VA and PA, which she probably has. Then she needs to sweep WI, MI, and MN, which is likely (even if Trump leads in WI right now). The critical state will be NV. It will likely determine the winner. If Trump takes one of WI MI and MN, bad news for Clinton. I had NV likely going for Trump, but I am told by a campaign doing internal polling in NV that NV will be in Clinton’s column. I’d be happy to be wrong.
BTW: Alaska is a 3-vote wild card. Last non-internet poll in AK had Clinton leading by +4% (or something). On the other hand, it is the ONLY poll that found her leading. And it was from an unknown pollster, so don’t bet the farm on AK.
7:59: Another point about NV: Most polling is likely to underestimate Clinton support because most polls don’t do Spanish versions.
8:00: Clinton takes CA, WA, and HI. Trump gets ID.
8:03: Unbelievable: Johnson is called in WI. No Senate for the Dem’s.
8:04: A couple of other points: First, I am assuming Trump will win IA, but Clinton seems to be running Strong there.
8:05: Trump takes NC.
8:22: Wisconsin is going to be VERY close. Humanity as we know it may depend on the cheesehead vote.
About 10 percent of Milwaukee County & 40 percent of Dane still to come in in WI.
— Scott Detrow (@scottdetrow) November 9, 2016
8:32 Trump takes Iowa and Utah. So it all comes down to MI (looking good for HRC), WI (too close) and NV.
About 10 percent of Milwaukee County & 40 percent of Dane still to come in in WI.
— Scott Detrow (@scottdetrow) November 9, 2016
incredible coda to the night https://t.co/6tCbPZcFBL
— Sam Stein (@samsteinhp) November 9, 2016
I want to take a moment to congratulate the Russians on their narrow victory.
— Darryl Holman (@hominidviews) November 9, 2016
9:20: Okay…Kathy has called and said we’ve lost power at the house, estimated until 11:00. I’m heading home.
11:32: AP has just called the election for Donald Drumpf. Should thing go as expected by Inauguration Day in January, we will be in for chaos.

I was hoping for a bunch of last minute polls being released today, but nada. Perhaps they were all released all last night.
I’m a bit unhappy with the way this election cycle is ending. Since I started aggregating state presidential polls in 2007, one of my objectives has been to see how accurate a simple binomial model can be at predicting the presidential election, using only polls as the data. The model did very well in the 2008 and 2012 cycles.
It is also a more difficult business in 2016. Obviously, the demise of the norm that there be a landline in nearly every home is an emerging problem. Many pollsters supplement landline polls with a cell phone sub-sample. This is expensive, because these calls must be done by people. Interactive voice or digit response polls aren’t permitted for cell phones.
A more difficult problem for my analyses is that there has been a proliferation of internet-based polls. You’ve probably seen them: YouGov, Insights West, Google Analytics, Ipsos/Reuters, SurveyMonkey, to name a few. Most of these polls work by surveying from a very large opt-in panel, and then mathematically adjust the results to match a demographic profile. So, if not enough 50-60 year old White women respond, the few who do respond are, essentially, cloned.
I’m sure this technology can work very well with a huge panel and careful background work to perfect the methods. It may be that some internet pollsters, say YouGov, have done so. But for every YouGov, there are probably a dozen internet polls that haven’t, and they frequently have bizarre results. I don’t want to be in the business of making subjective judgments about whose polls are “good enough” to accept. Therefore, I simply exclude polls that survey internet panels.
Another problem is that internet polls generally don’t have well defined sample sizes. My analyses need to know the “effective” size of each poll to work. “Effective” means the equivalent number of individuals who, if live-polled, would generate the same statistical information as the internet poll. This should, in principle, be easy to estimate using simulation methods like bootstrap resampling, but I am not aware of direct analytical solutions (which would, at a minimum, have to use the distribution of weights). In any case, “effective” sample sizes don’t see to have made it in internet polls yet.
Unfortunately, a number of pollsters switched—sometimes right in the middle of the election season—to using an internet panel. Pollsters that come to mind include Rasmussen, Gravis, and Public Policy Polling. These three pollsters make up a substantial fraction of the total state polls done in any season. I suppose I should accept an internet panel as an approximation of the cell phone sub-sample in a poll, but I didn’t this year. Rules and all that….
Finally, there is the bogus pollsters. Regular readers may recall my fisking of a bogus Pennsylvania poll earlier this year. That was easy…they were amateurs. But the issue could be difficult to identify in real time with a bit more competence.
If you haven’t read Goldy’s takedown of Remington Research and, to a lesser extent, Trafalgar Group, read it now. This development has me down, because I am now in the predicament of ignoring suspicious polls, or playing “poll cop,” something I detest.
I frequently laugh (and mock) right-wingers and their beefs with individual polls or pollsters—think “Unskewed Polls” from 2012. The charges usually amount to nothing but hating the fact that their candidate is losing. Get a grip!
But now, that is what I seem to be doing—calling out a pollster (or two) for bogus polls. There is one difference: my motivation is to be as accurate as possible. Bogus polls fuck with me, whether they come up showing the Democrat up or the Republican up. If lefties launched an effort to dump bogus pro-Democrat polls on the market in order fuck up the aggregated results, I would call the out as well, because their bogus polls would fuck with the accuracy of my polling analyses.
As an aside, remember Birther Queen Orly Taitz? She wrote a blog post a couple of days ago calling upon both Remington Research and Trafalgar Group to swoop into New Hampshire to stop the polling trend there. Here is part of her screed:
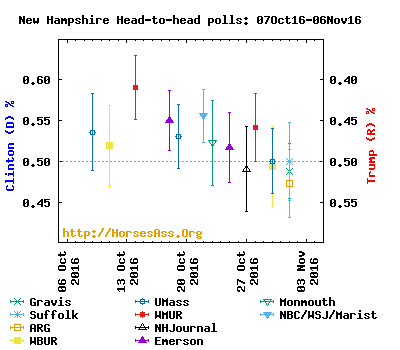
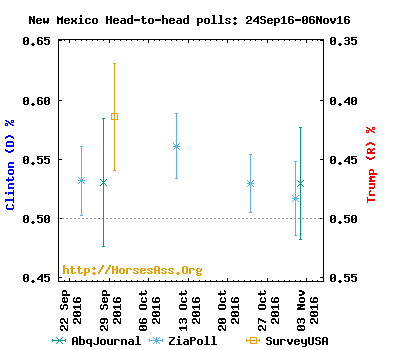
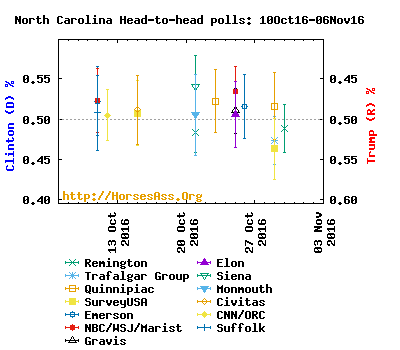
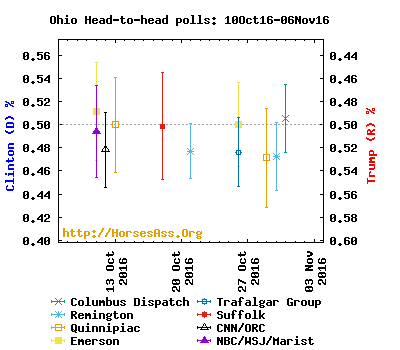
However, Democratic Party came up with an absolutely bogus poll from WMUR/UNH, showing Trump behind by 11%, which lowered his average from winning to being 0.6% behind and his total electoral votes from winning 270 to 266. This is a clear psy-op. You can see that all the polls showed Trump leading from 5% to Clinton leading by 1%. This poll showing Clinton ahead by 11% in NH is a complete farce. By the way, Republican senator, Kelly Ayotte, is leading by the same margin and the same WMUR/UNH came with a similar bogus poll to show her far behind.
Remington and Trafalgar pollsters need to post a true poll for New Hampshire ASAP. This poll will move Trump into the lead in NH and his total electoral votes will go up from 266 to winning 270!
Readers of Taitz report are asked to call Remington and Trafalgar pollsters and urge them to publish asap a true poll for New Hampshire
Huh…
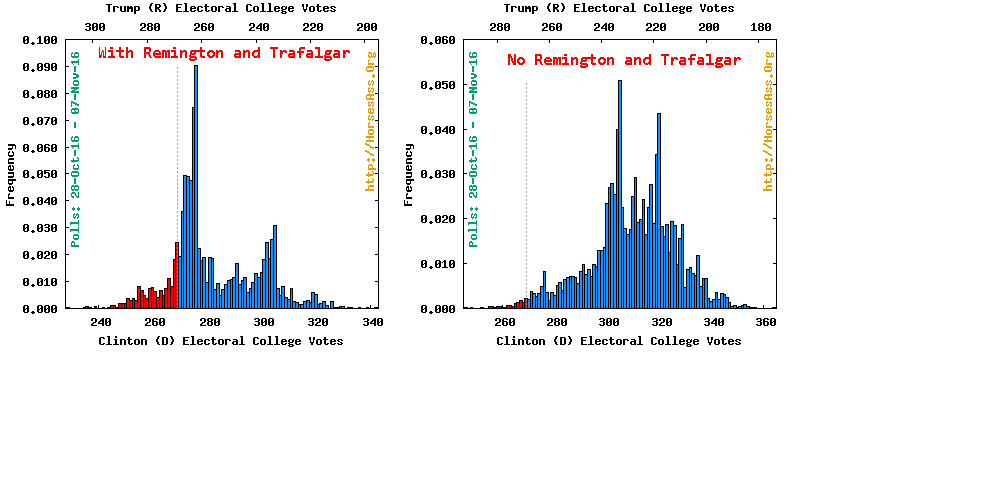
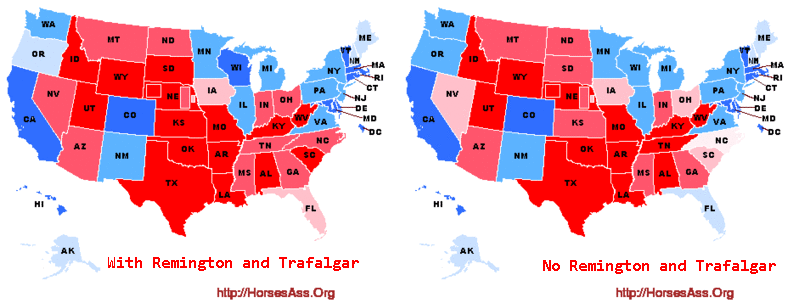
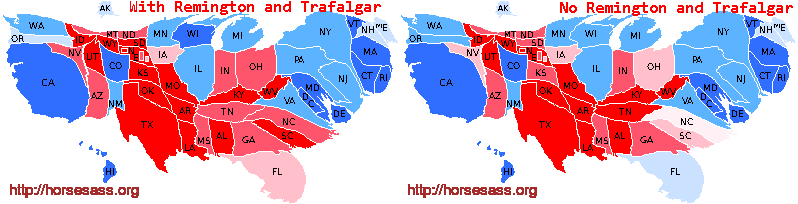
So, now I am in a position of having TWO sets of results. One set based on my stated rules and assumptions set out over a year ago. And I have the results excluding Remington Research and Trafalgar Group, whose polls I strongly suspect are bogus. Fuck, I hate that!
With any luck, we’ll know which version corresponds most closely to reality very soon. Finally, here are the relevant graphics, side by side. Click for a larger image.
![]() It’s election day! So, first, make sure you vote. You can find a ballot box (before 8pm) here or get your ballot in the U.S. mail and postmarked by midnight. Find out if you can vote here. In King County, accessible voting options (on-line ballot-marking and in-person voting centers) can be found here.
It’s election day! So, first, make sure you vote. You can find a ballot box (before 8pm) here or get your ballot in the U.S. mail and postmarked by midnight. Find out if you can vote here. In King County, accessible voting options (on-line ballot-marking and in-person voting centers) can be found here.
Then, please join us for an election-watching party at the Seattle Chapter of Drinking Liberally. We meet tonight and every Tuesday at the Roanoke Park Place Tavern, 2409 10th Ave E, Seattle. You’ll find us in the small room at the back of the tavern. We usually start at 8:00pm, but some of us will be their early to watch the election coverage.
Can’t make it to Seattle tonight? Check out one of the other 189 chapters of Living Liberally, including nineteen in Washington state, three in Oregon and one in Idaho. Find, or go out and start, a chapter near you.
Saturday’s analysis showed control of the Senate to likely remain in the hands of the Republicans. The Democrats had only a 12.1% probability of taking the Senate. I’ve added about 20 new polls since then. I’ve also shortened the “current poll” window to 10 days (if only to match the Presidential election).
Two days later, after 100,000 simulated elections, Democrats have a Senate majority 12,350 times, there were 26,823 ties), and Republicans control the Senate 60,827 times. In other words, Democrats have a 39.2% probability of controlling the Senate and Republicans have a 60.8% probability of controlling the Senate.
There has been a few interesting changes.
Here is the distribution of Senate seats from the simulations:*
This graphs shows the probability of at least each number of seats controlled by the Democrats:*
Expected outcomes from the simulations:
This table shows the number of Senate seats controlled for different criteria for the probability of winning a state:* Safe>0.9999, Strong>90%, Leans>60%, Weak>50%
| Threshold | Safe | + Strong | + Leans | + Weak |
|---|---|---|---|---|
| Safe Democrat | 43 | |||
| Strong Democrat | 4 | 47 | ||
| Leans Democrat | 1 | 1 | 48 | |
| Weak Democrat | 0 | 0 | 0 | 48 |
| Weak Republican | 1 | 1 | 1 | 52 |
| Leans Republican | 4 | 4 | 51 | |
| Strong Republican | 5 | 47 | ||
| Safe Republican | 42 |
This table summarizes the results by state. Click on the poll number to see the individual polls included for a state.
| # | Sample | % | % | Dem | Rep | ||
|---|---|---|---|---|---|---|---|
| State | @ | polls | size | Dem | Rep | % wins | % wins |
| AL | 0 | 0 | (0) | (100) | |||
| AK | 1& | 320 | 23.4 | 76.6 | 0.0 | 100.0 | |
| AZ | 6 | 4147 | 43.6 | 56.4 | 0.0 | 100.0 | |
| AR | 1& | 608 | 38.2 | 61.8 | 0.0 | 100.0 | |
| CA | 1 | 552 | 63.4 | 36.6 | 100.0 | 0.0 | |
| CO | 3 | 1681 | 54.3 | 45.7 | 99.3 | 0.7 | |
| CT | 1& | 872 | 61.7 | 38.3 | 100.0 | 0.0 | |
| FL | 4 | 2739 | 47.6 | 52.4 | 3.7 | 96.3 | |
| GA | 3 | 2008 | 44.1 | 55.9 | 0.0 | 100.0 | |
| HI | 0 | 0 | (100) | (0) | |||
| ID | 1& | 823 | 29.5 | 70.5 | 0.0 | 100.0 | |
| IL | 1 | 450 | 60.0 | 40.0 | 99.9 | 0.1 | |
| IN | 2 | 884 | 48.3 | 51.7 | 23.6 | 76.4 | |
| IA | 3 | 1804 | 37.1 | 62.9 | 0.0 | 100.0 | |
| KS | 1 | 535 | 36.4 | 63.6 | 0.0 | 100.0 | |
| KY | 1& | 566 | 41.5 | 58.5 | 0.2 | 99.8 | |
| LA | 1& | 794 | 34.6 | 65.4 | 0.0 | 100.0 | |
| MD | 1& | 614 | 66.6 | 33.4 | 100.0 | 0.0 | |
| MO | 6 | 4595 | 49.0 | 51.0 | 17.1 | 82.9 | |
| NV | 2 | 1332 | 49.6 | 50.4 | 42.9 | 57.1 | |
| NH | 7 | 4312 | 49.5 | 50.5 | 32.6 | 67.4 | |
| NY | 1 | 567 | 72.8 | 27.2 | 100.0 | 0.0 | |
| NC | 4 | 2777 | 49.2 | 50.8 | 28.2 | 71.8 | |
| ND | 0 | 0 | (0) | (100) | |||
| OH | 3 | 2342 | 38.6 | 61.4 | 0.0 | 100.0 | |
| OK | 0 | 0 | (0) | (100) | |||
| OR | 1& | 558 | 62.7 | 37.3 | 100.0 | 0.0 | |
| PA | 8 | 4945 | 52.4 | 47.6 | 99.3 | 0.7 | |
| SC | 1& | 941 | 38.4 | 61.6 | 0.0 | 100.0 | |
| SD | 1& | 534 | 39.3 | 60.7 | 0.1 | 99.9 | |
| UT | 2 | 778 | 28.7 | 71.3 | 0.0 | 100.0 | |
| VT | 1& | 559 | 69.1 | 30.9 | 100.0 | 0.0 | |
| WA | 1 | 641 | 56.8 | 43.2 | 99.2 | 0.8 | |
| WI | 3 | 2778 | 51.0 | 49.0 | 78.1 | 21.9 |
@ Current party in office
& An older poll was used (i.e. no recent polls exist).
*Analysis assume that the two independent candidates will caucus with the Democrats.
Details of the methods are given in the FAQ.
 |
 |
Yesterday’s analysis showed Sec. Hillary Clinton (D) leading Donald Trump (R) with 290 EVs to 248 EVs. If the election was held yesterday, we would expect Clinton to win with an 86.8% chance.
Since that analysis there have been about 28 new polls release that satisfy my inclusion criteria. I should point out, that the new polls include eight new polls from Remington Research (R) and four from Trafalgar Group (R). If the significance of this escapes you, read Goldy’s post.
One of the things I am going to do in this analysis is do two analyses: one with these two pollsters included, and one that excludes all Remington and Trafalgar polls. Pick the one you wish.
Which one is right? It is hard to say. I hate accusing a pollster of producing bogus polls. I’ve had numerous people complain about including this poll or that poll, and I ignore them. The entire premise of my effort is that by aggregating polls broadly, any “house effects” will cancel. But the oddities of Remington are clear. Trafalgar polls also seem quite dodgy.
Okay…Here we go. Scroll down or click here for the alternative analysis.
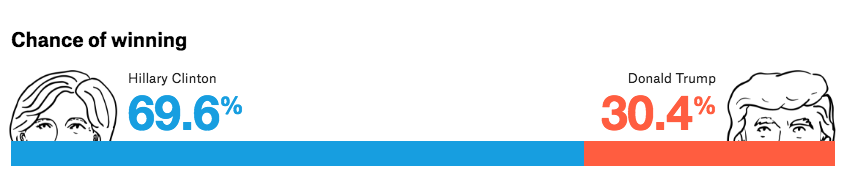
Today, after 100,000 simulated elections, Clinton wins 84,508 times and Trump wins 15,492 times (including the 2,449 ties). Clinton received (on average) 282 (-8) to Trump’s 256 (+8) electoral votes. In an election held now, Clinton would have a 84.5% probability of winning and Trump would have a 15.5% probability of winning. Thus, Clinton slips a bit, but the race isn’t changing much.
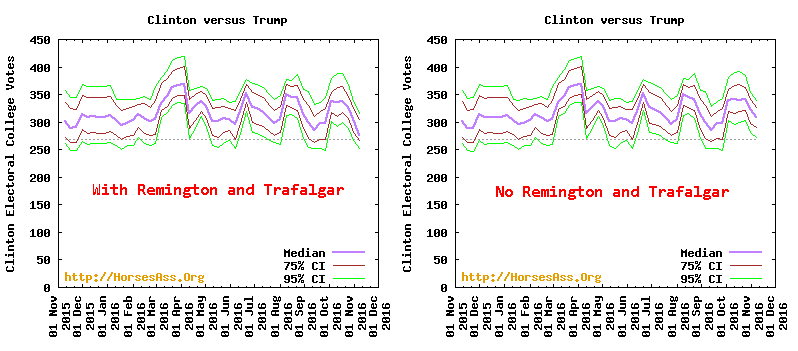
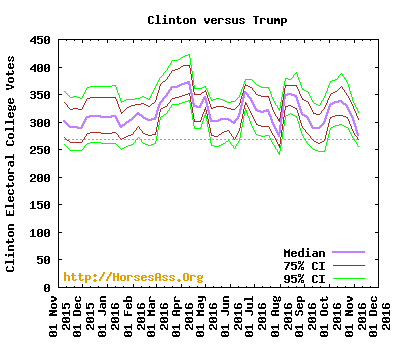
The long term trends in this race can be seen from a series of elections simulated every seven days using polls from 07 Nov 2015 to 07 Nov 2016, and including polls from the preceding ten days (FAQ).
An animated sequence of maps and electoral vote distributions can be seen here
Here is the distribution of electoral votes [FAQ] from the simulations:
[Read more…]
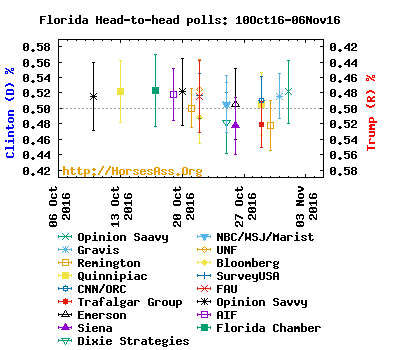
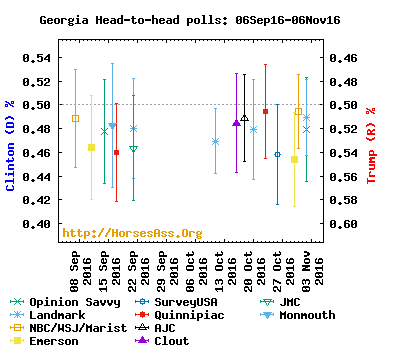
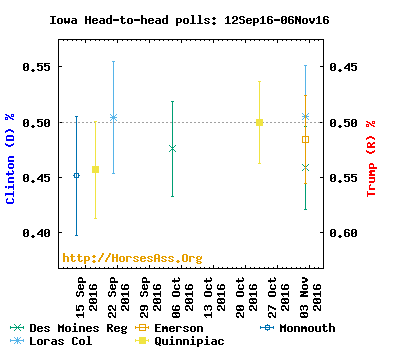
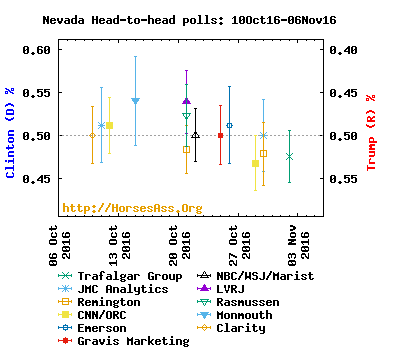
There’s been a lot of bedwetting in recent days over a flood of new polls that threatened to undermine the foundation of Hillary Clinton’s once formidable electoral college firewall. Key swing states like Florida, Nevada, and North Carolina, which for weeks had shown small but consistent leads for Clinton, suddenly plunged into Trump territory, while once solid leads in New Hampshire, Virginia, and Pennsylvania appeared to melt into the margin of error. As a result, polling aggregation sites from Nate Silver’s widely-followed 538 to Darryl’s less well known but equally pedigreed analyses here on HA showed Trump’s chances of winning surge into the disturbing realm of the remotely possible.
But what if some of the polls that introduced all this late uncertainty weren’t just wrong, they were, well, intentionally wrong?
Ignore for a moment the reasons why, but if your goal was to game the polling aggregation sites you would probably want to wait until the final weeks of the election to release a flood of new polls with absurdly large sample sizes (and absurdly low margins of error) surveying a handful of key swing states while providing little or no prior track record on which to judge your credibility. In other words: Meet the Remington Research poll.
Coming out of virtually nowhere, the Remington Research Group in collaboration with Axiom Strategies suddenly emerged as one of the most prolific pollsters of the fin de cycle électoral, simultaneously surveying eight “battleground” states on October 23, October 30, and again on November 3. This sudden displaying of polling prowess is particularly remarkable given the incredibly large size of its voter sample—and by “incredibly,” I do mean that these numbers are not credible.
For example, Remington’s November 3 poll (surveyed Nov 1-2) includes and analyzes the responses of 19,640 likely voters across eight states, ranging from a robust 1,793-voter sample in Nevada to an inexplicable 3,076-voter sample in Virginia. Compare that to the ten most recent Virginia polls posted to 538:
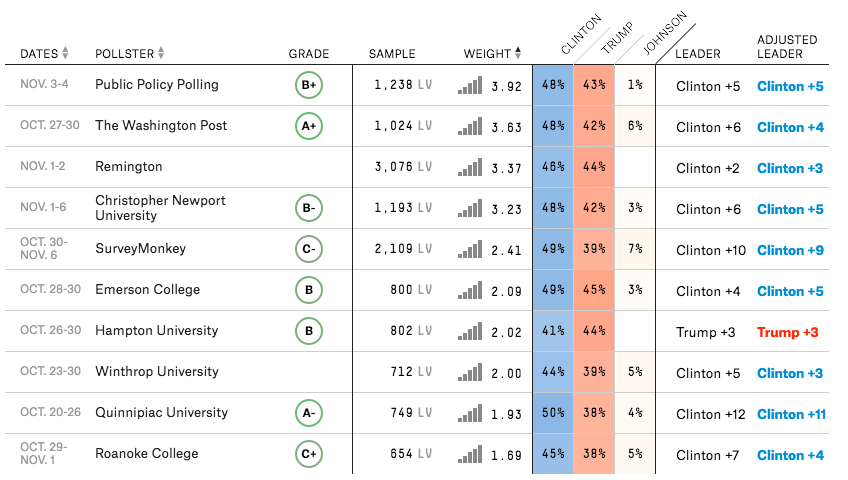
One of these things is not like the others.
The second largest sample size of the group is SurveyMonkey’s 2,109, and even that’s an outlier given that it’s an online poll that typically uses larger samples in order to compensate for selection bias and other errors. Remington claims to be conducting its surveys via IVR (interactive voice response) technology—good old fashioned robocalling—a method that normally would suffice with about a 1,000-voter sample in a state the size of Virginia. A similar pattern can be seen in survey after survey, state after state, with Remington standing out by far as the largest sample size in any state (and generally one of the most Trump-leaning).
Darryl continues to include Remington in his analysis because it fits his inclusion criteria, and he correctly does not want to change criteria mid-cycle. But those large sample sizes immediately jumped out at Darryl as odd. As Darryl explains, response rates for IVR are notoriously low—probably around 10 percent. That means Remington would have needed to dial about 200,000 voters over two days to achieve its 19,640-voter sample, and then analyze all these results. That may not be beyond the capabilities of a large, established pollster, but it’s not the sort of operation one builds overnight. Further catching Darryl’s eye is Remington’s unusually low reported margin of error: “+/- 1.77” in that Virginia poll, for example. That’s not only weirdly low, it’s weirdly precise; experienced pollsters don’t tend to present that number out to the second decimal place, says Darryl.
Remember: polling is expensive. A typical 600-800-voter IVR survey might cost a campaign or media outlet about $8,000 or more, and a live interviewer telephone survey would cost several times that. (A high-quality live-interview bilingual internal poll of the sort statewide campaigns use might cost $30,000 or more.) So why would Axiom/Remington put in the extra time and money to survey four times as many voters as the typical public state poll?
One obvious answer would be to game the average margins calculated by all these polling aggregators everyone is obsessing on. I’m way oversimplifying it, but the way these polling aggregators generally work is that they add up all the samples from various polls over a specified period of time, and then do some math to them. They essentially create one giant poll out of many in an effort to smooth out the variation and find (as Silver would say it) “the signal in the noise.” (Darryl could explain it better, but in many more words. If you’re curious, you can read his entire simulation FAQ here.)
And what that means is that Remington’s 3,076-voter survey that had Clinton at just +2 influences the average about 4.7 times more than Roanoke College’s 654-voter sample that had Clinton at a robust +7. (Well, not exactly. But again, ask Darryl.) In fact, under most models, Remington’s extremely low reported margin of error would overweight its impact even more.
Thus, flood the media with some very-large-sample Trump-leaning polls, and the state of the race in some of these battleground states starts to look very different. For example, as of last night, Darryl had Clinton with only a 27.9 percent probability of winning Florida—but remove the Remington polls and Clinton’s probability jumps to 68.2 percent! In other words, a single pollster can flip Florida. Likewise, Clinton’s probability of winning an Electoral College majority would’ve climbed from 80 percent with Remington to 94 percent without. For many nervous poll-watchers, that’s the difference between wet sheets and dry sheets.
But what’s in it for Remington? Well, to know for sure, you’d have to ask the Remington Group. Or maybe their partner, Axiom Strategies. Or better yet, Ted Cruz’s former presidential campaign chief strategist Jeff Roe, who happens to own both the Remington Group and Axiom Strategies. But I have three theories:
Whatever the reason, the fact is that these Remington polls just don’t pass the smell test. (Clinton is winning only 65% of African-Americans in Virginia, and only 48% of Hispanics in Nevada? I don’t think so.) And Remington isn’t the only late-comer to flood the swing state polling swamp with suspiciously pro-Trump results. Republican consultancy shop Trafalgar Group (infamous robocaller and former Chris Christie advisor Robert Cahaly) has generated a wave of weirdly-worded surveys that purport to reveal a “shy Trump-voter” demographic that every other pollster has missed! Trafalgar too calculates its margin of error to the second decimal place, a level of precision that feels out-of-place amidst their outlier results. (Trump is up 2 points in Michigan, or something!)
Yeah, sure, all of the aggregators will ultimately call this election correctly, in that Clinton will win by some margin or another. And at this late stage there’s little if any argument over who is leading where. But I’ve no doubt that Republicans are attempting to game the system in a way that makes this whole poll aggregation endeavor far less useful than it was in the past two presidential cycles. So don’t be surprised on Tuesday night if the presidential election turns out to be less competitive than we’ve all been led to believe.
This is the last Open Thread before election day. Please get your ballot postmarked or dropped off by tomorrow. President is important, but so is literally everything else on the ballot. Here once again is how you can find your ballot dropbox location in King County. Get it in by 8:00 there.
I voted straight ticket Dem. I also voted for all the initiatives (as well as ST and the Seattle hotels one). That is surprising to me, as my first instinct on any given ballot measure is to vote no.
 |
 |
On Friday, my analysis showed Sec. Hillary Clinton leading Donald Trump with a mean of 295 to 243 electoral votes. If the election had been held on Friday, Clinton would have won with a 94.2% probability.
There were only a few new polls released on Saturday. On Sunday a few more were released and I found a few missing from the database. We now have eleven new polls added since the last analysis. Of course, some polls will “age-out” on account of being more than ten days old.
Today, after 100,000 simulated elections, Clinton wins 86,835 times and Trump wins 13,165 times (including the 2,645 ties). Clinton received (on average) 290 (-5) to Trump’s 248 (+5) electoral votes. In an election held now, Clinton would have a 86.8% probability of winning and Trump would have a 13.2% probability of winning.
The biggest changes occur in ten states + Maine’s two Congressional districts. Five of these changes favor Clinton and six favor Trump.
The long term trends in this race can be seen from a series of elections simulated every seven days using polls from 06 Nov 2015 to 06 Nov 2016, and including polls from the preceding ten days (FAQ).
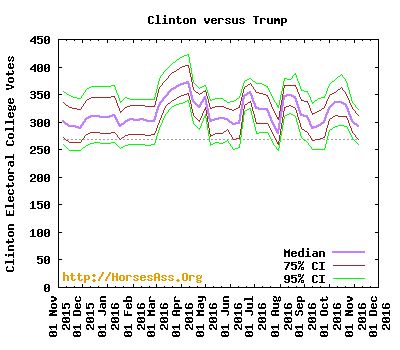
An animated sequence of maps and electoral vote distributions can be seen here
Here is the distribution of electoral votes [FAQ] from the simulations:
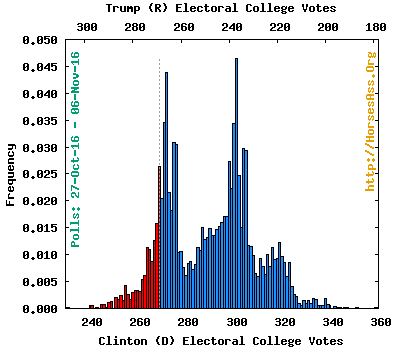
The distribution takes on an interesting bimodal (or even trimodal) form. The major modes at 301 and 272 are caused by the fact that Florida is nearly a toss-up (272 + Florida’s 29 EVs = 301). If tonight was election night, an early call in Florida would tell us whether Clinton walks away with the election or whether it is going to be a long night!
The small variability around the two major modes is largely driven by the fact that New Hampshire is almost a toss-up.
That third mode to the right is largely driven by Ohio, which isn’t quit a toss-up at an 86% chance of going to Trump.
Exodus 25:15
Don’t ever remove the poles from the rings.
Discuss.
My analysis last Sunday showed control of the Senate to be a toss up at 48% probability for Democrats and 52% for Republicans. The expected outcome was a 49 to 51 split in favor of the Republicans.
Since then, I’ve added something exceeding 50 polls to the mix. As we saw in the Presidential race, the polls since last Sunday have tended to be more favoriable to Republicans.
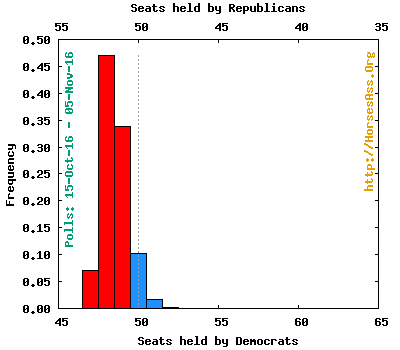
Today, after 100,000 simulated elections, Democrats have a Senate majority 1,762 times, and I’ll assume they control the Senate with the 10,293 ties. The Republicans control the Senate 87,945 times. This suggests Democrats have a 12.1% probability of controlling the Senate and Republicans have a 87.9% probability of controlling the Senate. So, indeed, the Democrat’s chances have fallen.
The Republican candidate has primarily gained in five states.
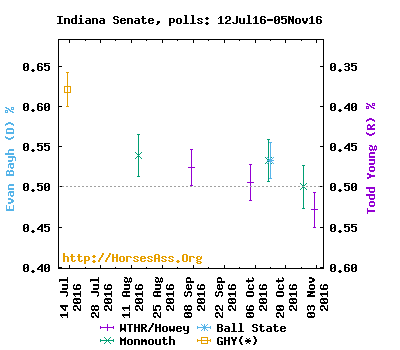
In Indiana, Democrat Evan Bayh’s once solid lead has vanished. Last Sunday, he had an 88.5% probability of defeating Todd Young (R). Today he would win with a 24.1% probability. The polling picture pretty much tells the story.
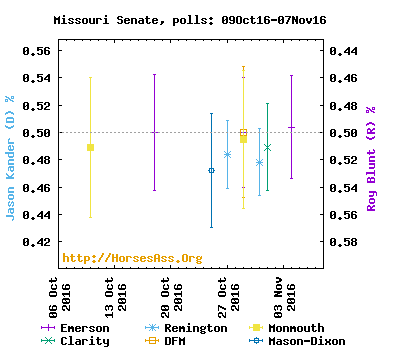
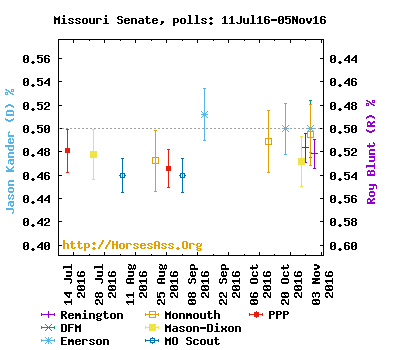
Sen. Roy Blunt (R) has strengthened his lead over Jason Kander (D) in Missouri. Last analysis Blunt was at a 77.8% probability of winning, but five new polls, including two ties and three with Blunt up, puts the probability at 92.8% today. On the other hand, two months ago, there was little evidence that Blunt would lose.
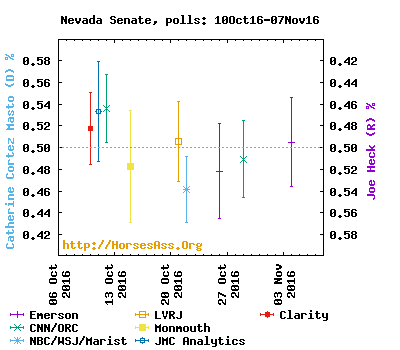
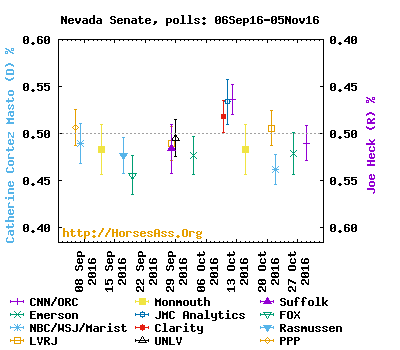
In Nevada, five polls aged out, and these mostly favored Catherine Cortez Mastro (D) over Joe Heck (R). Heck leads in four of the five current polls. Consequently, the Republican has gone from a 54% to a 93% probability of winning today.
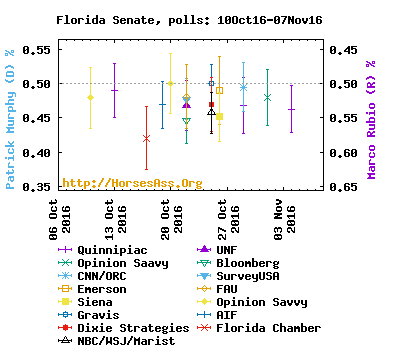
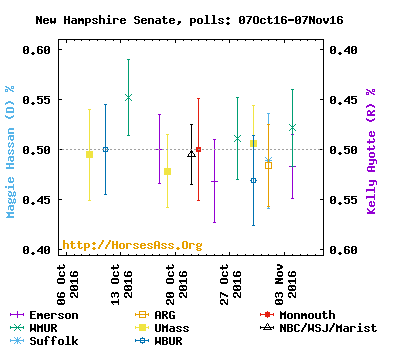
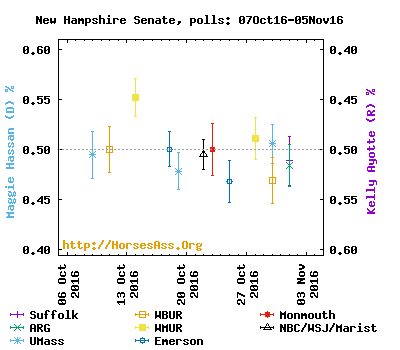
The story is somewhat similar in New Hampshire. Four polls aged out, including one that had Maggie Hassan (D) up by +9 over Sen. Kelly Ayotte (R). The new polling has mostly been more favorable to Ayotte. We now have ten current polls, six that favor Ayotte, two that favor Hassan, and two ties. The net result is that Ayotte has gone from a 67% chance to an 86% chance of winning an election today.
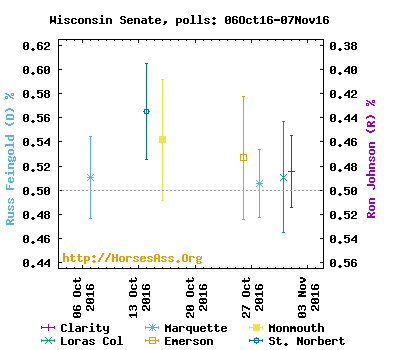
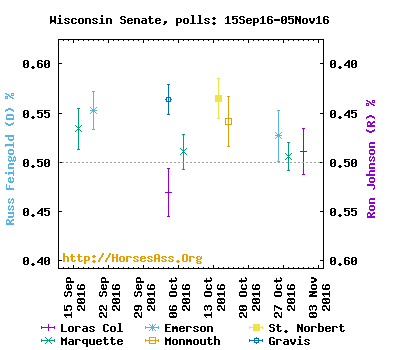
In Wisconsin, four polls aged out, including one with Russ Feingold leading Sen. Ron Johnson by +12%. The four current polls have Feingold up by +8%, +5%, +1%, and +2%. As a result, Feingold’s chances have dropped from 99.8% to 85.9%.
Democrats have made a couple of notable gains.
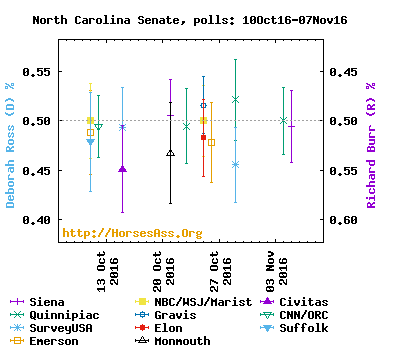
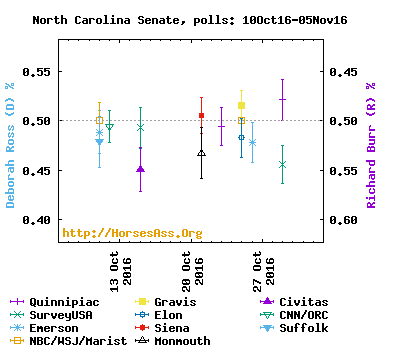
The North Carolina senate race largely favors Sen. Richard Burr (R) over challenger Deborah Ross (D). But the last couple of days have seen one tie and two polls that favor the Democrat. The result is that Burr has fallen from a 90% probability of winning last Sunday to an 86% chance today.
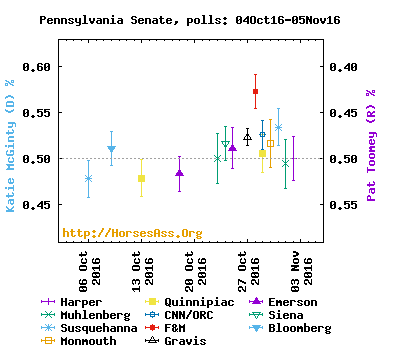
The biggest news for Democrats happens in Pennsylvania, where Sen. Pat Toomey (R) is being challenged by Democrat Katie McGinty. Seven polls aged-out, and these polls were pretty much a toss-up between the two candidates. Eight new polls have been added that largely favor McGinty. With the four carry-over polls, we now have two current polls that favor Toomey, eight that favor McGinty, and two ties. As a result, Pennsylvania has flipped from red to blue. McGinty was at a 45.8% probability of winning last Sunday, and she would win a race today with a 99.7% probability.
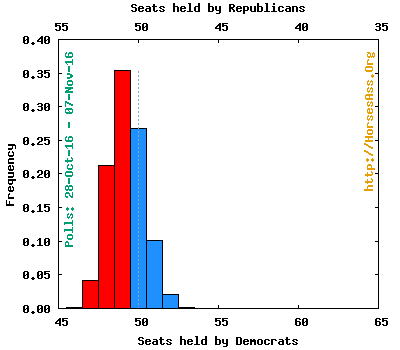
Here is the distribution of Senate seats from the simulations:*
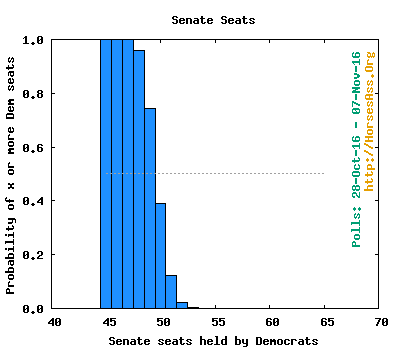
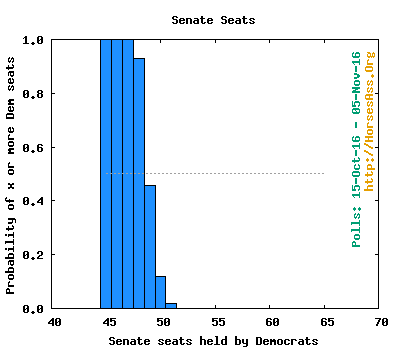
This graphs shows the probability of at least each number of seats controlled by the Democrats:*
Expected outcomes from the simulations:
This table shows the number of Senate seats controlled for different criteria for the probability of winning a state:* Safe>0.9999, Strong>90%, Leans>60%, Weak>50%
| Threshold | Safe | + Strong | + Leans | + Weak |
|---|---|---|---|---|
| Safe Democrat | 45 | |||
| Strong Democrat | 2 | 47 | ||
| Leans Democrat | 1 | 1 | 48 | |
| Weak Democrat | 0 | 0 | 0 | 48 |
| Weak Republican | 0 | 0 | 0 | 52 |
| Leans Republican | 3 | 3 | 52 | |
| Strong Republican | 4 | 49 | ||
| Safe Republican | 45 |
This table summarizes the results by state. Click on the poll number to see the individual polls included for a state.
| # | Sample | Percent | Percent | Democrat | Republican | ||
|---|---|---|---|---|---|---|---|
| State | @ | polls | size | Democrat | Republican | % wins | % wins |
| AL | 0 | 0 | (0) | (100) | |||
| AK | 1& | 320 | 23.4 | 76.6 | 0.0 | 100.0 | |
| AZ | 6 | 3957 | 43.6 | 56.4 | 0.0 | 100.0 | |
| AR | 2 | 1006 | 38.7 | 61.3 | 0.0 | 100.0 | |
| CA | 3 | 2372 | 62.0 | 38.0 | 100.0 | 0.0 | |
| CO | 3 | 1681 | 54.3 | 45.7 | 99.2 | 0.8 | |
| CT | 1& | 872 | 61.7 | 38.3 | 100.0 | 0.0 | |
| FL | 13 | 9570 | 47.4 | 52.6 | 0.0 | 100.0 | |
| GA | 6 | 3788 | 43.4 | 56.6 | 0.0 | 100.0 | |
| HI | 0 | 0 | (100) | (0) | |||
| ID | 1 | 823 | 29.5 | 70.5 | 0.0 | 100.0 | |
| IL | 3 | 1973 | 56.8 | 43.2 | 100.0 | 0.0 | |
| IN | 2 | 884 | 48.3 | 51.7 | 24.1 | 75.9 | |
| IA | 4 | 2548 | 38.1 | 61.9 | 0.0 | 100.0 | |
| KS | 1 | 535 | 36.4 | 63.6 | 0.0 | 100.0 | |
| KY | 2 | 1323 | 43.4 | 56.6 | 0.1 | 99.9 | |
| LA | 1& | 794 | 34.6 | 65.4 | 0.0 | 100.0 | |
| MD | 1& | 614 | 66.6 | 33.4 | 100.0 | 0.0 | |
| MO | 7 | 5594 | 48.6 | 51.4 | 7.2 | 92.8 | |
| NV | 5 | 3356 | 48.2 | 51.8 | 6.6 | 93.4 | |
| NH | 10 | 6238 | 49.1 | 50.9 | 14.4 | 85.6 | |
| NY | 1 | 568 | 71.0 | 29.0 | 100.0 | 0.0 | |
| NC | 11 | 7216 | 49.1 | 50.9 | 15.3 | 84.7 | |
| ND | 0 | 0 | (0) | (100) | |||
| OH | 3 | 1609 | 40.9 | 59.1 | 0.0 | 100.0 | |
| OK | 0 | 0 | (0) | (100) | |||
| OR | 1& | 558 | 62.7 | 37.3 | 100.0 | 0.0 | |
| PA | 12 | 9083 | 51.9 | 48.1 | 99.7 | 0.3 | |
| SC | 1& | 941 | 38.4 | 61.6 | 0.0 | 100.0 | |
| SD | 3 | 2031 | 36.7 | 63.3 | 0.0 | 100.0 | |
| UT | 3 | 1394 | 29.5 | 70.5 | 0.0 | 100.0 | |
| VT | 1 | 559 | 69.1 | 30.9 | 100.0 | 0.0 | |
| WA | 2 | 1103 | 59.4 | 40.6 | 100.0 | 0.0 | |
| WI | 4 | 2465 | 51.6 | 48.4 | 85.9 | 14.1 |
@ Current party in office
& An older poll was used (i.e. no recent polls exist).
*Analysis assume that the two independent candidates will caucus with the Democrats.
Details of the methods are given in the FAQ.
Follow me (@hominidviews) on Twitter for Senate and Presidential polling and analysis updates.
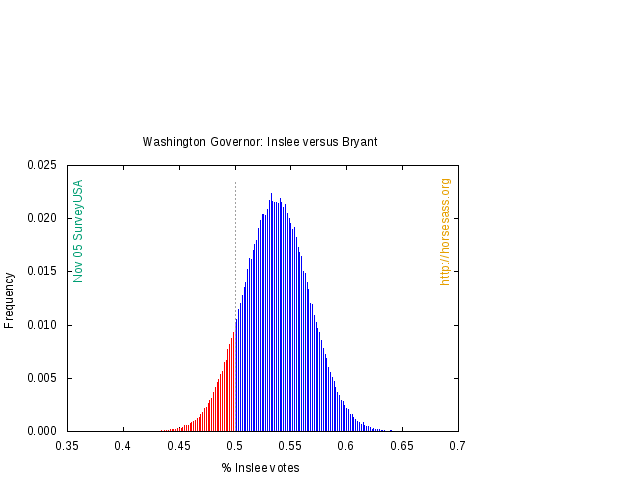
A new SurveyUSA poll today sheds some light on the 2016 Washington gubernatorial election between Gov. Jay Inslee and Bill Bryant. The poll, taken from 31-Oct to 2-Nov surveyed 667 likely voters in Washington state (3.9 MOE). Inslee took 50% and Bryant, 43%.
There were 620 people who went for Inslee or Bryant. If we consider only these 620 people, Inslee receives 53.8% and Bryant 46.2%.
A Monte Carlo analysis employing a million simulated elections finds that Inslee wins 903,218 times and Bryant wins 91,992 times. (Other or Undecided wins 4790 times.)
Inslee wins 90.8% of the simulated elections to Bryant’s 9.2%, suggesting that Inslee has about a 91% chance of winning, based only on the evidence contained in this poll.
Here is the distribution of votes from the simulated elections.
Of course, we have other polls in this election that shed additional light. Here is the polling over the past 8 months in the election suggesting that there has been almost no change in the race over the past eight months.
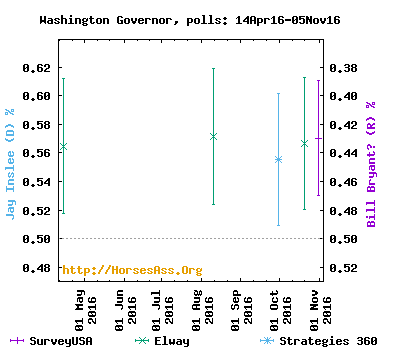
The relative stasis in the race suggests that we can combine the October Elway poll with the current poll. The Elway poll, taken 20-22 October, surveyed 502 individuals (4.5 MOE) and found Inslee leading 51% to 39%. If we repeat the previous analysis using both polls, Inslee wins 989,592 times and Bryant wins 9,805 times. The evidence from these two polls, suggests that Inslee will win with near certainty (99.0% probability).
The distribution of votes looks like this.
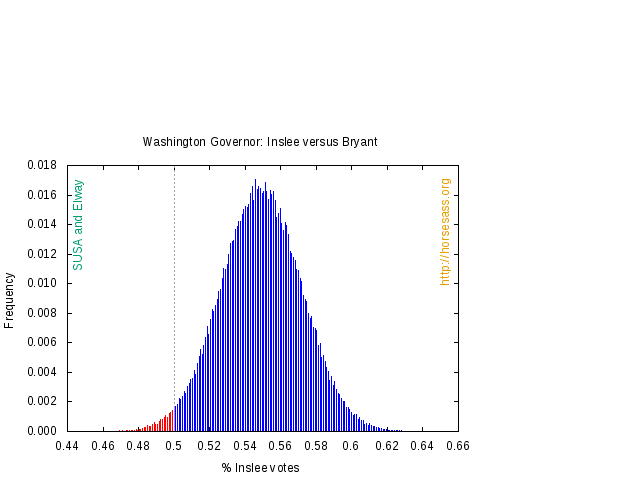
There you have it. If the election was held today, Inslee would beat Bryant. I don’t expect the race to change much between now and Tuesday, but it is wise to keep in mind that anything can happen in politics.
John Oliver: Segregation.
Your mission.
Matthew Filipowicz: How to protest the Bundy way!.
Meet the Alt Right:
Al Sharpton interviews Pres. Obama Part I.
Al Sharpton interviews Pres. Obama Part II.
How the Electoral College work?
Holy Shit! You’ve Got To Vote!
Conan: Election battle–Drumpf Tower versus Hillary’s Chappaqua home.
What is the difference between a Ponzi vs. a pyramid scheme.
Mental Floss: 26 scientific studies about animals.
The 2016 Sexual Predator Comedy Tour Staring Donald “Fuckface von Clownstick” Drumpf:
White House: West Wing Week.
Scariest moments of the 2016 election.
Late Show: FBI: Email Reader Unit.
John Batiste teaches you how to vote.
Weed, guns, and minimum wage: What else is the U.S. voting on?.
Farron Cousins: Emails reveal GOP plot to block North Carolina African Americans from voting.
Secret booth.
Tour the International Space Station.
Hillary Makes Herstory:
Seth Meyers: Polls are tightening….
Sam Seder: Why is the Left fighting a carbon tax in Washington State?.
David Pakman: GOP obstructionists threaten to keep Clinton Supreme Court seat empty.
PsychoSuperMom: Voter fraud is a fraud:
Samantha Bee interviews President Obama.
Young Turks: Chris Christie cronies guilty in Bridgegate scandal
You Make Me Feel.
Kids take time out from trick-or-treating to discuss the election.
Four likely outcome of the election.
Young Turks: How Southern states are rigging the election.
Last week’s Friday Night Multimedia Extravaganza can be found here.
 Eager to share our brilliant political commentary and blunt media criticism, but too genteel to link to horsesass.org? Well, good news, ladies: we also answer to HASeattle.com, because, you know, whatever. You're welcome!