| Obama | Romney |
| 86.5% probability of winning | 13.5% probability of winning |
| Mean of 288 electoral votes | Mean of 250 electoral votes |
The previous analysis showed President Barack Obama leading Gov. Mitt Romney by 295 to 243 electoral votes. The Monte Carlo simulation had Obama winning 93.9% of the elections, and Romney winning 6.1%.
The polls have been trickling in over the weekend and on Monday. At press time (which really means, “start running the analysis” time I was able to dig up 16 new polls:
| start | end | sample | % | % | % | |||
|---|---|---|---|---|---|---|---|---|
| st | poll | date | date | size | MOE | O | R | diff |
| AZ | Rocky Mountain | 04-Oct | 10-Oct | 523 | 4.4 | 44 | 42 | O+2 |
| CO | Gravis Marketing | 05-Oct | 11-Oct | 2089 | 2.2 | 48.4 | 46.0 | O+2.4 |
| FL | Gravis Marketing | 13-Oct | 14-Oct | 617 | 4.0 | 48 | 49 | R+1 |
| FL | PPP | 12-Oct | 14-Oct | 791 | 3.4 | 48 | 49 | R+1 |
| GA | Abt SRBI | 08-Oct | 12-Oct | 706 | 5.3 | 43 | 51 | R+8 |
| ID | Mason-Dixon | 08-Oct | 10-Oct | 625 | 4.0 | 27 | 63 | R+36 |
| IA | ARG | 11-Oct | 14-Oct | 600 | 4.0 | 48 | 48 | tie |
| NM | Research & Polling | 09-Oct | 11-Oct | 658 | 3.8 | 49 | 39 | O+10 |
| NC | PPP | 12-Oct | 14-Oct | 1084 | 3.0 | 47 | 49 | R+2 |
| NC | High Point U | 06-Oct | 10-Oct | 302 | — | 43 | 49 | R+6 |
| NC | High Point U | 29-Sep | 04-Oct | 291 | — | 49 | 40 | O+9 |
| OH | PPP | 12-Oct | 13-Oct | 880 | 3.3 | 51 | 46 | O+5 |
| PA | PPP | 12-Oct | 14-Oct | 500 | 4.4 | 51 | 44 | O+7 |
| PA | Muhlenberg | 10-Oct | 14-Oct | 438 | 5.0 | 47 | 44 | O+3 |
| SD | Neilson Brothers | 01-Oct | 05-Oct | 762 | 3.6 | 41.1 | 51.6 | R+10.5 |
| VA | ARG | 12-Oct | 14-Oct | 600 | 4.0 | 47 | 48 | R+1 |
A big surprise from a new poll in Arizona: it gives Obama a weak lead over Romney. It seems improbable, but there you have it. There are only two current polls in Arizona, and Romney is up by +9 in the other one. Consequently, Romney would be expected to win the state with an 84% probability.
Colorado has Obama up by +2.4% over Romney in today’s poll. With eight current polls weighing in, the state is pretty close to a tie. Romney would be expected to win the state now with a 60% probability. Here is the trend:

Romney takes a +1% lead in both of the new Florida polls. Overall, he has a 87% probability of winning the state in an election held today.
We finally get an Idaho poll, and Romney leads Obama by +36%. Now we know why nobody wants to poll in the state.
Iowa is all tied up at 48% in today’s poll. But Obama leads in the only other current poll, so he ends up with a 59% chance of winning at this point.
The new New Mexico poll puts Obama up by a solid +10%—a margin right in line with the other two current polls.
There are three new polls for North Carolina, but notice that the High Point University polls include a pre-debate poll, where Obama leads, and a post debate poll, where Romney leads. He also leads in the third new poll (which is post debate). The current polls, taken together, give Romney a 97% chance of winning now. Romney has clearly recaptured the lead he held in August:

Ohio puts Obama up by +5% in today’s poll. The collection of 10 Ohio polls give Obama a +2% and 85% probability of taking the state in an election now. The long-term trend shows something of a dip in Obama’s lead, but not enough to tie up the state or give the lead to Romney.

Obama’s lead in two new Pennsylvania polls. Overall, Obama wins all ten of the current polls. That makes 37 consecutive polls that have gone to Obama, all the way back to early February.
Virginia gives Romney a +1% lead in the current poll. Romney leads in five of eight current polls and there is also a tie in one poll. Oddly enough because Obama leads more strongly in one large poll, he gets a slight overall advantage, with a 54% chance of winning an election held now.
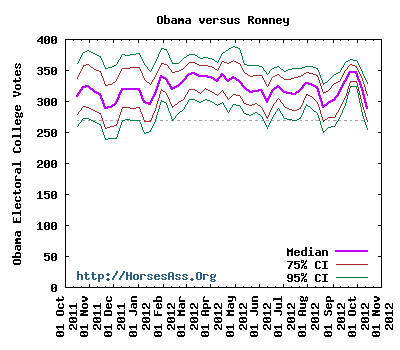
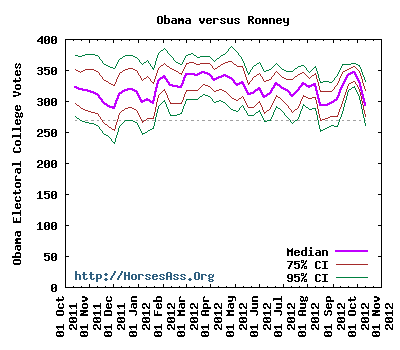
After 100,000 simulated elections, Obama wins 86,465 times and Romney wins 13,535 times (including the 1,003 ties). Obama receives (on average) 288 (-7) to Romney’s 250 (+7) electoral votes. Obama has a 86.5% (-7.4%) probability of winning and Romney has a 13.5% (+7.4%) probability of winning.
The long term trends in this race can be seen from a series of elections simulated every seven days using polls from 15 Oct 2011 to 15 Oct 2012, and including polls from the preceding 14 days (FAQ).