| Obama | Romney |
| 97.2% probability of winning | 2.8% probability of winning |
| Mean of 305 electoral votes | Mean of 233 electoral votes |
The previous analysis showed President Barack Obama leading Mitt Romney by 302 to 236 electoral votes. If the election was held then, Obama would be expected to win with a 96.9% probability, and Romney with a 3.1% probability.
Only seven new polls covering five states have been released since then. But, on the heels of the Republican convention and the start of the Democratic convention, this seems like a good place to take stock of the race. First, the new polls:
| start | end | sample | % | % | % | |||
|---|---|---|---|---|---|---|---|---|
| st | poll | date | date | size | MOE | O | R | diff |
| FL | PPP | 31-Aug | 02-Sep | 1548 | 2.5 | 48 | 47 | O+1 |
| MI | EPIC/MRA | 28-Aug | 28-Aug | 1200 | 2.6 | 49 | 46 | O+3 |
| MO | PPP | 28-Aug | 29-Aug | 621 | 3.9 | 41 | 53 | R+12 |
| NC | PPP | 31-Aug | 02-Sep | 1012 | 3.1 | 48 | 48 | tie |
| NC | SurveyUSA | 26-Aug | 30-Aug | 543 | 4.3 | 43 | 46 | R+3 |
| NC | Elon U | 25-Aug | 30-Aug | 1089 | 3.0 | 43 | 47 | R+4 |
| WV | R.L. Repass | 22-Aug | 25-Aug | 401 | 4.9 | 38 | 52 | R+14 |
Close as ever, the new Florida poll has Obama leading Romney by +1%. This poll has been taken as evidence for a lack of a strong convention (or Ryan) bump. But, who knows in Florida, the next poll may go strongly for Romney.
Michigan puts Obama over Romney by a rather weak +3%. The longer term trend suggests a much tighter race than earlier in the year. But Obama still seems to have the advantage:

A surprise poll comes out of Missouri, where Romney leads Obama by +12%. This double digit lead is a wider gap than we have seen recently. But the real surprise is the increasing variability seen among pollsters. Just two polls ago, Rasmussen found Obama leading Romney by +1%:

Three North Carolina polls mostly favor Romney. The two tie in the most recent poll. The two other polls give Romney a +3% and +4% advantage. With six “current” polls in the state, the weight of evidence is that Romney would win the state (now) with a 69% probability:

In West Virginia, Romney leads Obama by a +14%. Believe it or not, this race has tightened up since the last couple of polls.
Now, after 100,000 simulated elections, Obama wins 97,197 times and Romney wins 2,803 times (including the 330 ties). Obama receives (on average) 305 (+3) to Romney’s 233 (-3) electoral votes. Obama has a 97.2% (+0.3%) probability of winning and Romney has a 2.8% (-0.3%) probability of winning an election held now. The difference from the previous analysis is really too small to “make” anything over.
Now, let’s consider the longer term trends in this race. I’ve done as series of Monte Carlo analyses, conducted every seven days using all the polls from the last year. For each simulation, I follow the same rules of including only polls from the past month (and the most recent poll before then if there are none) (FAQ). The following graph shows how the election is “scored” over time. The middle (magenta) line is the median number of electoral votes for Obama. When that line dips below the dashed line, Romney wins. Above it, Obama wins.
The pair of tan lines show the interval of electoral college totals within which 75% of the results for Obama were found. And the outer green lines show the interval of electoral college totals within which 95% of the results for Obama were found.
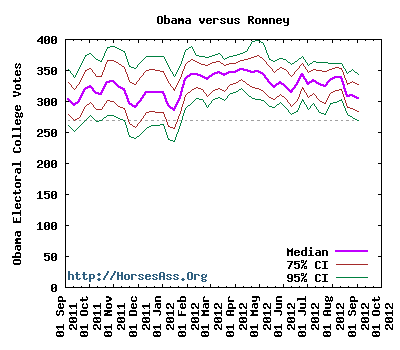
Romney was at his best in the 4th quarter of 2011. Even then, his probability of winning the election was never greater than about 30%. Beginning in late January, Romney slipped into zero percent territory, and has been there until recently. He has now recovered to same place he was in late January.
The general election has just started, so we are at a point with much potential for big change in the standings. In 2008, we saw McCain begin to do, only to have Obama run away with it in the end.


