Strategies 360 has released a new poll that covers, among other things, the Washington state gubernatorial race between former Congressman Jay Inslee (D) and state AG Rob Mckenna (R). The poll of 500 likely voters (4.4% MOE) was taken from the 17th to the 20th of October.
The poll is tied up at 46% when leaners are included. (Without leaners, Inslee leads McKenna 43% to 40%, but my policy is to work with the numbers that include leaners.)
Obviously, at 50% each there is little point at running a Monte Carlo analysis. But, we now have four polls covering this race over the past several weeks:
| Start | End | Sample | % | % | ||
|---|---|---|---|---|---|---|
| Poll | date | date | size | MOE | Inslee | McKenna |
| Strategies 360 | 17-Oct | 20-Oct | 500 | 4.4 | 46.0 | 46.0 |
| PPP | 15-Oct | 16-Oct | 574 | — | 48.0 | 42.0 |
| SurveyUSA | 12-Oct | 14-Oct | 543 | 4.3 | 47.0 | 44.0 |
| Washington Poll | 01-Oct | 16-Oct | 644 | 3.9 | 47.1 | 46.3 |
So, it would be worth analyzing all four of these polls together. The pooled polls gives a sample of 2,801 of which 2,558 go for one or the other candidates. Inslee gets 1,323 (47.2%) of the “votes” and McKenna gets 1,235 (44.1%).
The Monte Carlo analysis of 1,000,000 simulated elections using the pooled data gives Inslee wins 890,208 times and McKenna wins 107,592 times. If the election was held now, we would expect Inslee to win with a 89.2% probability and McKenna with a 10.8% probability. Here is the distribution of election outcomes:

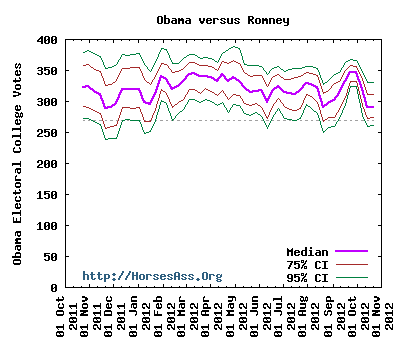
Clearly, what we have had all October is a very close race, but one in which Inslee has maintained a small edge. It looks to me like the race has tightened up a bit since September, as frequently happens in the final weeks of an election:

The poll had a number of other interesting results for other races as well:
- Obama 51%, Romney 35%
- Initiative 1240 (Charter schools): 51% support, 34% oppose
- Initiative 502 (marijuana): 54% support, 38% oppose
- Referendum 74 (Uphold same-sex marriage law): 55% approve, 38% reject
The poll also asked people’s opinion on some topics. In looking for strategies to raise revenue to meet the Supreme Court’s ruling to better fund public education, 54% supported and 41% opposed an income tax on people making more that $200K. For capital gains tax on investment income, 47% supported the idea and 44% opposed. What people really hated was increases in state property tax, sales tax or B&O tax. Most people (59% support, 36% oppose) support an increase in state funding for higher education.
All in all, this survey makes Washington state look solid blue—except for that squeaker of a gubernatorial race.