Washington Senators for Washington:
Young Turks: Republican’s War on Math.
Maddow: End of campaign bluster.
White House: West Wing Week.
Willard (and Friends):
- Liberal Viewer: Should Mr. Burns endorse Mitt Romney?
- SlateTV: Chrysler refutes Ohio Romney ad
- Young Paul Ryan.
- Ann Telnaes: Romney’s change.
- Mitt Romney is autistic:
SlateTV: Why don’t we get rid of the electoral college.
Schoolhouse Rock: Election Rock, with conspiracy theories.
Young Turks: debate audience laugh at Michele Bachmann.
Cock-block the Vote.
Roy Zimmerman: I’m in:
Politics of Disaster:
- Ann Telnaes: Romney’s all wet..
- Sam Seder: Occupy Sandy….
- Young Turks: Mitt v. Climate change.
- Sam Seder: Mitt Romney implies hurricane Sandy recovery just like cleaning up HS football celebration
- SlateTV: Chris Christie can’t stop praising Obama.
- Mark Fiore: The Emergency Private Sector Alert System.
- Sam Seder: FEMA + Romney Administration = Disaster
- Stephen: Hurricane Sandy nightmare
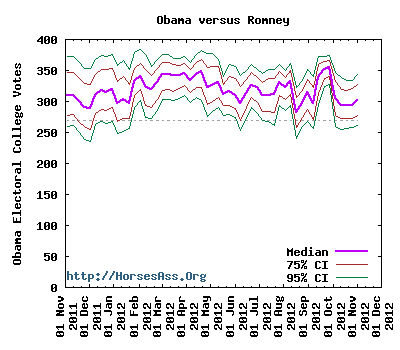
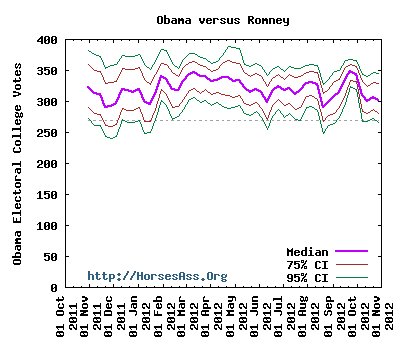
Political Kombat ’12: Obama vs Romney.
Maddow: States with weird election laws.
Thom with the Good, the Bad, and the Very, Very Ugly.
Jon: Dystopian hellscape that Is Ohio.
Liberal Viewer: Romney stung by repeating a FAUX News lie in debate.
Letterman: VP Joe does the top-10 on voting early.
Last week’s Friday Night Multimedia Extravaganza can be found here.