My analysis last Tuesday showed control of the Senate going to the Democrats with a 63.5% probability and 50 seats. I’ve added a bunch of new Senate polls since then, and things look tied up.
Today, after 100,000 simulated elections, Democrats have a Senate majority 15,370 times and there were 32,633 ties (which I presume would go to the Democrats), and Republicans control the Senate 51,997 times. So, in an election held today, Democrats would have a 48% probability of controlling the Senate and Republicans would have a 52% probability of controlling the Senate.
Essentially, the Senate is a toss-up. Here are the most important changes since Tuesday.
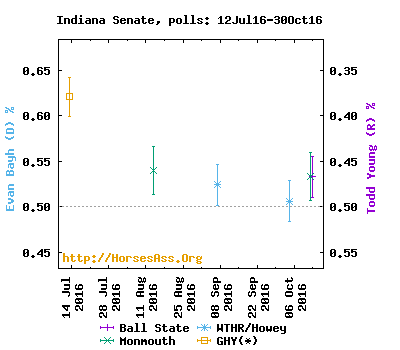
In the Democrats’ favor, Indiana has gained some clarity from a couple of new polls that favor Democrat Evan Bayh over Republican Todd Young. Bayh’s chances have gone from 56% to 89%.
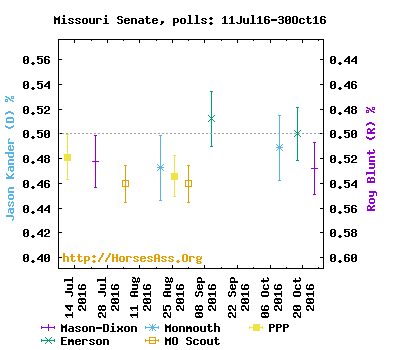
Three new polls in Missouri move the race in favor of Republican Sen. Roy Blunt over Democrat Jason Kander. Blunt has gone from a a 35% chance last Tuesday to a 78% chance of taking the seat today.
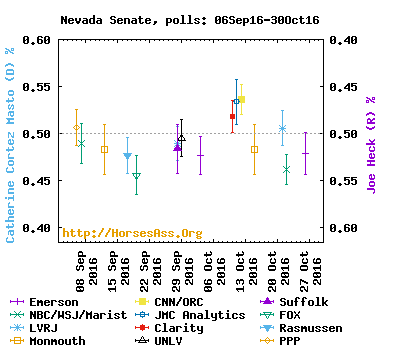
In Nevada, we have a battle between Democrat Catherine Cortez Masto and Republican Joe Heck for Sen. Harry Reid’s (D) old seat. We have seven new polls and a couple of continuing polls since Tuesday, when Heck led in every poll. Today, Heck leads in 5 and Masto leads in 4 polls. Consequently, Heck’s chances have declined from 96% to 54%…pretty much a toss-up.
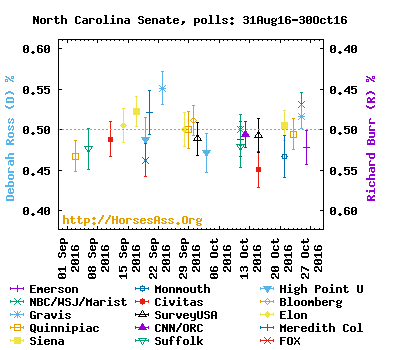
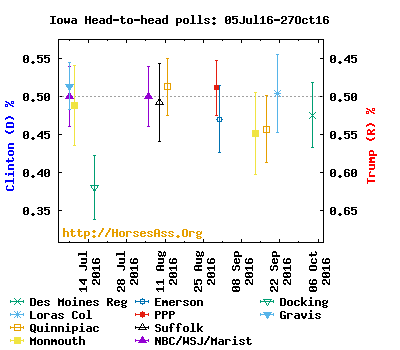
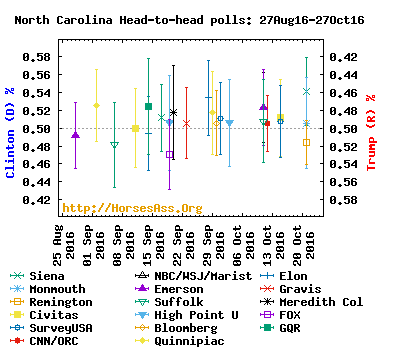
Today, we have eight new North Carolina polls and four carry-overs from last Tuesday, when the polls pretty evenly split between Democrat Deborah Ross and Republican Sen. Richard Burr. But the new polls have almost entirely gone against the Ross, and her chances have declined from 69% on Tuesday to 10% today.
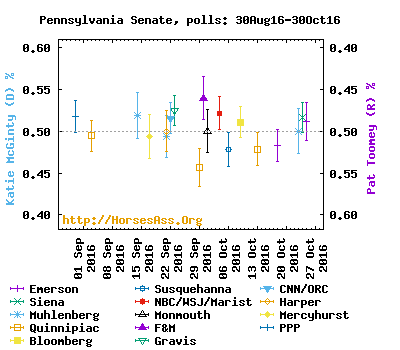
In Pennsylvania, we have five new polls and five carry-over polls. The new polls have been a bit less favorable to Democrat Katie McGinty. Her chances against Republican Sen. Pat Toomey have declined a bit from 69% to 46%–basically the state is a toss-up.
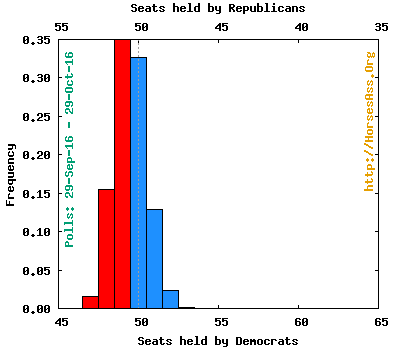
Here is the distribution of Senate seats from the simulations:*
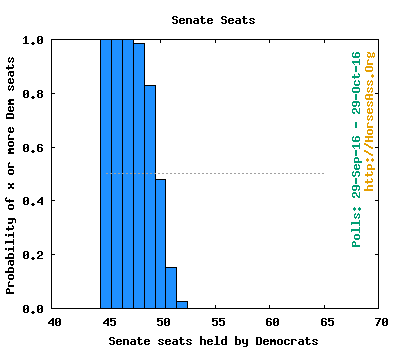
This graphs shows the probability of at least each number of seats controlled by the Democrats:*
- 100000 simulations: Democrats control the Senate 48.0%, Republicans control the Senate 52.0%.
- Average ( SE) seats for Democrats: 49.5 (1.0)
- Average (SE) seats for Republicans: 50.5 (1.0)
- Median (95% CI) seats for Democrats: 49 (48, 52)
- Median (95% CI) seats for Republicans: 51 (48, 52)
Expected outcomes from the simulations:
- Democratic seats w/no election: 35
- Independent seats w/no election: one
- Republican seats w/no election: 30
- Contested Democratic seats likely to remain Democratic: nine
- Contested Republican seats likely to remain Republican: 21
- Contested Democratic seats likely to switch: one
- Contested Republican seats likely to switch: three
This table shows the number of Senate seats controlled for different criteria for the probability of winning a state:* Safe>0.9999, Strong>90%, Leans>60%, Weak>50%
| Threshold | Safe | + Strong | + Leans | + Weak |
|---|---|---|---|---|
| Safe Democrat | 46 | |||
| Strong Democrat | 1 | 47 | ||
| Leans Democrat | 1 | 1 | 48 | |
| Weak Democrat | 0 | 0 | 0 | 48 |
| Weak Republican | 2 | 2 | 2 | 52 |
| Leans Republican | 3 | 3 | 50 | |
| Strong Republican | 4 | 47 | ||
| Safe Republican | 43 |
This table summarizes the results by state. Click on the poll number to see the individual polls included for a state.
| # | Sample | % | % | Dem | Rep | ||
|---|---|---|---|---|---|---|---|
| State | @ | polls | size | Dem | Rep | % wins | % wins |
| AL | 0 | 0 | (0) | (100) | |||
| AK | 1 | 320 | 23.4 | 76.6 | 0.0 | 100.0 | |
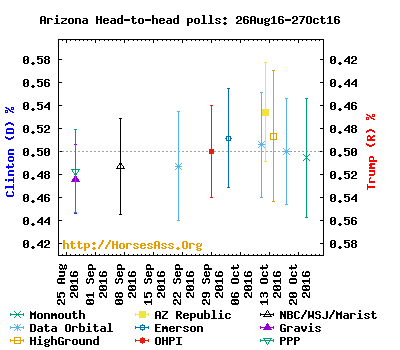
| AZ | 3 | 1425 | 42.9 | 57.1 | 0.0 | 100.0 | |
| AR | 1 | 398 | 39.4 | 60.6 | 0.2 | 99.9 | |
| CA | 2 | 1137 | 66.3 | 33.7 | 100.0 | 0.0 | |
| CO | 4 | 2463 | 57.5 | 42.5 | 100.0 | 0.0 | |
| CT | 1& | 872 | 61.7 | 38.3 | 100.0 | 0.0 | |
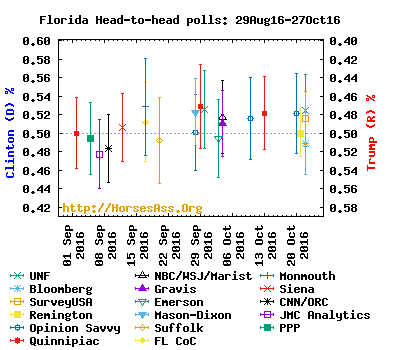
| FL | 13 | 8100 | 47.4 | 52.6 | 0.0 | 100.0 | |
| GA | 4 | 3001 | 42.4 | 57.6 | 0.0 | 100.0 | |
| HI | 0 | 0 | (100) | (0) | |||
| ID | 2 | 1309 | 30.2 | 69.8 | 0.0 | 100.0 | |
| IL | 2 | 1780 | 57.1 | 42.9 | 100.0 | 0.0 | |
| IN | 3 | 1361 | 52.3 | 47.7 | 88.5 | 11.5 | |
| IA | 1 | 744 | 40.5 | 59.5 | 0.0 | 100.0 | |
| KS | 1 | 506 | 36.2 | 63.8 | 0.0 | 100.0 | |
| KY | 1& | 440 | 43.2 | 56.8 | 1.9 | 98.1 | |
| LA | 1& | 794 | 34.6 | 65.4 | 0.0 | 100.0 | |
| MD | 1& | 614 | 66.6 | 33.4 | 100.0 | 0.0 | |
| MO | 3 | 1450 | 48.6 | 51.4 | 22.2 | 77.8 | |
| NV | 9 | 6135 | 49.9 | 50.1 | 46.4 | 53.6 | |
| NH | 9 | 5573 | 49.6 | 50.4 | 32.6 | 67.4 | |
| NY | 1 | 568 | 71.0 | 29.0 | 100.0 | 0.0 | |
| NC | 14 | 8208 | 49.0 | 51.0 | 10.0 | 90.0 | |
| ND | 0 | 0 | (0) | (100) | |||
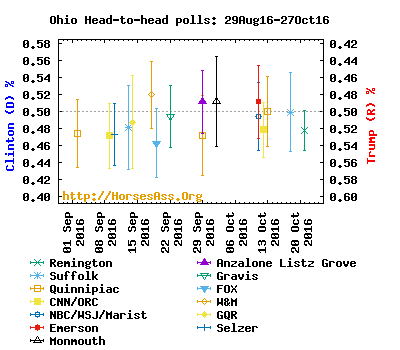
| OH | 9 | 5050 | 41.5 | 58.5 | 0.0 | 100.0 | |
| OK | 0 | 0 | (0) | (100) | |||
| OR | 2 | 1619 | 61.7 | 38.3 | 100.0 | 0.0 | |
| PA | 11 | 6155 | 49.9 | 50.1 | 45.8 | 54.2 | |
| SC | 1& | 941 | 38.4 | 61.6 | 0.0 | 100.0 | |
| SD | 0 | 0 | (0) | (100) | |||
| UT | 2 | 983 | 31.8 | 68.2 | 0.0 | 100.0 | |
| VT | 2 | 1085 | 70.9 | 29.1 | 100.0 | 0.0 | |
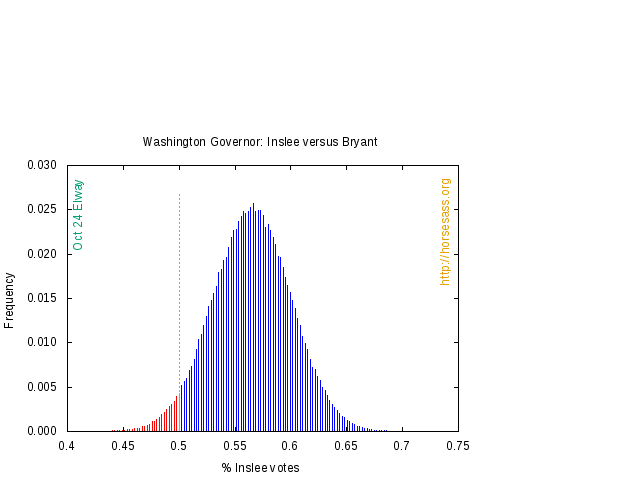
| WA | 1 | 462 | 63.0 | 37.0 | 100.0 | 0.0 | |
| WI | 6 | 3659 | 53.5 | 46.5 | 99.8 | 0.2 |
@ Current party in office
& An older poll was used (i.e. no recent polls exist).
*Analysis assume that the two independent candidates will caucus with the Democrats.
Details of the methods are given in the FAQ.
Follow @hominidviews on Twitter for Senate and Presidential polling and analysis updates.


