 |
 |
The previous analysis consisted of almost entirely pre-RNC polls, and the Monte Carlo analysis, based only on polls, suggested that Donald Trump would have no chance of winning an election held then. We now have a half dozen new post-RNC polls, including polls in NC, OH, and NV. As you might expect, the post-RNC polls show Trump, now the G.O.P. nominee, doing better against the likely Democratic nominee, Hillary Clinton.
A change in this analysis is that I’ve tightened the “current poll” window from polls taken in the past three months to polls taken within the past month. This has two possible effects for each state. First, it makes the polling data more current, which is particularly important for an accurate portrayal of Trump’s performance. His image among Republicans has dramatically changed over the past 6 months, and we can expect he will start polling better now that he is the nominee. Additionally, the smaller “current poll” window will increase the uncertainty for many states just because there are fewer polled individuals included. Thus, we see some states turn from solid in the previous analysis to strong in this analysis.
Now, after 100,000 simulated elections, Clinton wins 97,074 times and Trump wins 2,926 times (including the 205 ties). Clinton received (on average) 314 to Trump’s 224 electoral votes. In an election held now, Clinton would have a 97.1% probability of winning and Trump would have a 2.9% probability of winning.
Update: Yes…Vermont is the wrong color on account of a data entry error for one VT poll. This has been corrected for the next analysis.
Did Trump get a convention bump? It appears so.
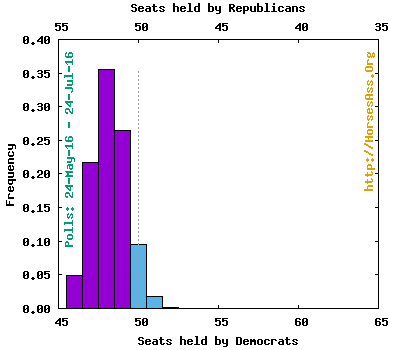
Here is the distribution of electoral votes [FAQ] from the simulations:
[Read more…]

