| Obama | Romney |
| 100.0% probability of winning | 0.0% probability of winning |
| Mean of 336 electoral votes | Mean of 202 electoral votes |
My previous Monte Carlo analysis, conducted one week ago, showed President Barack Obama leading Governor Mitt Romney by (on average) 306 to 232 electoral votes. If the election had been held last week, the analysis suggested that Obama would win with a 97.9% probability.
I guess I waited too long to do a new analysis, because the past week has brought us 47 new polls (plus a poll that breaks out Maine’s two congressional districts):
| start | end | sample | % | % | % | |||
|---|---|---|---|---|---|---|---|---|
| st | poll | date | date | size | MOE | O | R | diff |
| CA | Field Poll | 06-Sep | 17-Sep | 891 | 3.4 | 58 | 34 | O+24 |
| CO | Rasmussen | 17-Sep | 17-Sep | 500 | 4.5 | 45 | 47 | R+2 |
| CO | Quinnipiac | 11-Sep | 17-Sep | 1497 | 3.0 | 48 | 47 | O+1 |
| CO | ARG | 10-Sep | 12-Sep | 600 | 4.0 | 49 | 47 | O+2 |
| CO | SurveyUSA | 09-Sep | 12-Sep | 615 | 4.0 | 47 | 46 | O+1 |
| CT | U CT | 11-Sep | 16-Sep | 508 | 4.4 | 53 | 32 | O+21 |
| FL | WeAskAmerica | 18-Sep | 18-Sep | 1230 | 2.8 | 49.1 | 45.5 | O+3.6 |
| FL | FOX News | 16-Sep | 18-Sep | 829 | 3.0 | 49 | 44 | O+5 |
| FL | Gravis Marketing | 15-Sep | 16-Sep | 1728 | 2.5 | 47.1 | 47.7 | R+0.6 |
| IA | Rasmussen | 19-Sep | 19-Sep | 500 | 4.5 | 44 | 47 | R+3 |
| KY | SurveyUSA | 11-Sep | 13-Sep | 606 | 4.1 | 39 | 53 | R+14 |
| ME | PPP | 17-Sep | 18-Sep | 804 | 3.5 | 55 | 39 | O+16 |
| ME | Maine PRC | 15-Sep | 17-Sep | 856 | 3.4 | 53.5 | 37.3 | O+16.2 |
| ME1 | Maine PRC | 15-Sep | 17-Sep | 445 | — | 58.7 | 33.9 | O+24.8 |
| ME2 | Maine PRC | 15-Sep | 17-Sep | 410 | — | 47.8 | 41.0 | O+6.8 |
| MA | WBUR | 15-Sep | 17-Sep | 507 | 4.4 | 59 | 31 | O+28 |
| MA | UMass-Lowell | 13-Sep | 17-Sep | 497 | 5.5 | 59 | 36 | O+23 |
| MA | Suffolk | 13-Sep | 16-Sep | 600 | 4.0 | 63.5 | 30.5 | O+33.0 |
| MA | PPP | 13-Sep | 16-Sep | 876 | 3.3 | 57 | 39 | O+18 |
| MA | WNEU | 06-Sep | 13-Sep | 444 | 4.6 | 60 | 38 | O+22 |
| MI | Detroit News | 15-Sep | 17-Sep | 600 | 4.0 | 52.0 | 37.8 | O+14.2 |
| MI | CNN | 14-Sep | 18-Sep | 754 | 3.5 | 52 | 44 | O+8 |
| MI | MRG | 10-Sep | 15-Sep | 600 | 4.0 | 47.5 | 42.3 | O+5.2 |
| MI | Baydoun | 12-Sep | 12-Sep | 1156 | 2.9 | 45.5 | 43.7 | O+1.8 |
| NV | Rasmussen | 18-Sep | 18-Sep | 500 | 4.5 | 47 | 45 | O+2 |
| NV | CNN | 14-Sep | 18-Sep | 741 | 3.5 | 49 | 46 | O+3 |
| NH | Rasmussen | 18-Sep | 18-Sep | 500 | 4.5 | 45 | 48 | R+3 |
| NH | ARG | 15-Sep | 17-Sep | 463 | 4.5 | 48 | 47 | O+1 |
| NJ | Philadelphia Inquirer | 09-Sep | 12-Sep | 600 | 4.0 | 51 | 37 | O+14 |
| NJ | Fairleigh Dickinson | 06-Sep | 12-Sep | 706 | 3.8 | 52 | 38 | O+14 |
| NC | Rasmussen | 13-Sep | 13-Sep | 500 | 4.5 | 45 | 51 | R+6 |
| OH | Rasmussen | 12-Sep | 12-Sep | 500 | 4.5 | 47 | 46 | O+1 |
| OH | ARG | 10-Sep | 12-Sep | 600 | 4.0 | 48 | 47 | O+1 |
| OR | SurveyUSA | 10-Sep | 13-Sep | 552 | 4.3 | 49.5 | 40.7 | O+8.9 |
| PA | WeAskAmerica | 18-Sep | 18-Sep | 1214 | 2.9 | 48.1 | 42.2 | O+5.9 |
| PA | Muhlenberg | 10-Sep | 16-Sep | 640 | 4.0 | 50 | 41 | O+9 |
| PA | Philadelphia Inquirer | 09-Sep | 12-Sep | 600 | 4.0 | 50 | 39 | O+11 |
| VA | FOX News | 16-Sep | 18-Sep | 1006 | 3.0 | 50 | 43 | O+7 |
| VA | WeAskAmerica | 17-Sep | 17-Sep | 1238 | 2.8 | 48.5 | 45.7 | O+2.8 |
| VA | PPP | 13-Sep | 16-Sep | 1021 | 3.1 | 51 | 46 | O+5 |
| VA | Quinnipiac | 11-Sep | 17-Sep | 1474 | 3.0 | 50 | 46 | O+4 |
| VA | WA Post | 12-Sep | 16-Sep | 847 | 4.0 | 52 | 44 | O+8 |
| VA | Rasmussen | 13-Sep | 13-Sep | 500 | 4.5 | 49 | 48 | O+1 |
| WA | Elway | 09-Sep | 12-Sep | 405 | 5.0 | 53 | 36 | O+17 |
| WA | SurveyUSA | 07-Sep | 09-Sep | 524 | 4.4 | 54.4 | 37.6 | O+16.8 |
| WI | PPP | 18-Sep | 19-Sep | 842 | 3.4 | 52 | 45 | O+7 |
| WI | Rasmussen | 17-Sep | 17-Sep | 500 | 4.5 | 49 | 46 | O+3 |
| WI | Marquette | 13-Sep | 16-Sep | 601 | 4.1 | 54 | 40 | O+14 |
| WI | Quinnipiac | 11-Sep | 17-Sep | 1485 | 3.0 | 51 | 45 | O+6 |
I’ll just comment briefly on some states. Overall, the week’s polling looks very good for Obama, but with a couple of minor exceptions.
Obama takes three of four Colorado polls. This suggests a slight but real lead in the state. The Monte Carlo analysis gave Obama an 84% probability of winning based on the seven current polls.
Obama comes out on top in Florida. He has led in seven of the eleven polls taken over the past month.
Iowa is one of the few bright spots for Romney. He leads Obama by +3% in this week’s poll. But Obama leads in the other current poll, and overall has a very slight edge.
Romney looks destined to loose his boyhood home state of Michigan that gives Obama leads in four polls ranging from +2% to +14%.
Nevada is looking blue, but not by much. Combined with one other poll from the past month, the analysis gives Obama an 81% probability of taking the state.
Romney is up by +3% in one poll and down by -1% in another in New Hampshire. Combined with one other current poll Obama gets a 63% probability of winning now.
The other bit of good news for Romney is the most recent North Carolina poll that has Romney leading Obama by a modest +6%. Romney now leads in five of eight current polls and must be considered the leader in the state. A turn-around for Romney can be discerned from the last 6 months of polling:

There are three new Ohio polls, but I accidentally left the new FOX News poll out for this analysis. Even without that +7% for Obama, the two new polls give Obama a slight lead. Romney has only led in one of the seven current polls, and Obama would be expected to win the state now with a 90% probability. (The FOX News poll will be in the next analysis.)
We finally get a new poll in Oregon, and Obama is still up by something over 8%.
Pennsylvania is still looking blue. The past past month of polling has Obama winning an election now with certainty.
Six new polls in Virginia all go pretty convincingly for Obama. The polling history over six months completes the story…whatever advantage Romney had in the state a few weeks ago was transient:

It doesn’t look like Ryan will be delivering Wisconsin to Romney. The four new polls range from +3% to +14% for Obama. If anything, the selection of Ryan has moved the state further into Obama’s column:

Now, after a Monte Carlo analysis employing 100,000 simulated elections, Obama wins 99,975 times and Romney wins 25 times. Obama receives (on average) 336 to Romney’s 202 electoral votes. The analysis suggests that, in an election right now, Obama would have very nearly a 100.0% probability of defeating Romney.
The long term trends in this race can be seen from a series of elections simulated every seven days using polls from 20 Sep 2011 to 20 Sep 2012, and including polls from the preceding month (FAQ). Obama is performing near his peak for the election season.
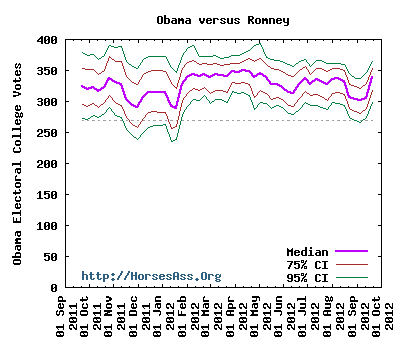
Here is the distribution of electoral votes [FAQ] from the simulations:
[Read more…]