On top of the instrumental benefits of getting the hell around much faster, Sound Transit expansion will be good for the environment. It’s sort of duh, but it’s nice to be able to read some specifics. It’s nice to be able to say it will cut over 360 million vehicle miles per year, save 800,000 tons of annual carbon emissions. Rather than just I assume it must be because driving is still driving.
Search Results for: 10,000
Poll Analysis: Clinton surges post-debate
 |
 |
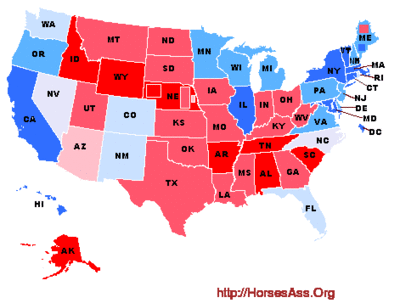

We have now had a few days for post-debate polls to trickle out. My previous analysis, four days ago, was almost entirely pre-debate polls. It showed Clinton with a 79.2% probability of winning the election with, on average, 288 electoral votes.
There have been about 20 or so post-debate state head-to-head polls released, mostly in competitive states. The results confirm the general wisdom that Clinton gained the edge from the first debate.
Today, after 100,000 simulated elections, Clinton wins 92,456 times and Trump wins 7,544 times (including the 1,007 ties). Clinton received (on average) 300 to Trump’s 238 electoral votes. In an election held now, Clinton would have a 92.5% probability of winning and Trump would have a 7.5% probability of winning.
A couple of states showed some interesting changes:
In Colorado one poll aged out and we got two new polls today that both have Clinton up by +11%. This has moved the probability from 51.4% for Trump to 83.7% for Clinton. The state is still quite close, but the magnitude of Clinton’s lead in two polls suggest that Clinton now has the advantage.

The story is similar in Florida one poll aged out, and three new polls were released, all with Clinton leading. Clinton’s leads, however, are smaller at 4%, +0.2% and 5%. Clinton is leading in 6 of the 10 current polls. Trump had a 60.6% probability of taking Florida 4 days ago, now Clinton is up with a 62.9% probability. The state is still mighty close!

Trump gains a bit in Iowa, not because of any new polls—there have been none since the debate. Rather one poll aged out. Trump leads in 2 of the 3 current Iowa polls.
Nevada gains two new polls with Clinton up by +6% and +1%. As a result Trump’s probability of winning of 66.8% four days ago has shrunk to 47.6%. This is, basically, a tie.

New Hampshire is over-polled because of a competitive Senate race. We lost one poll and gained two new ones in 4 days with Clinton up +6% and +7%. Clinton’s chances go up a bit to a 99.1% probability of winning today.
We have one new poll in New Jersey for a total of 2 polls. This one has Clinton up 6.4%, and so Clinton moves from a 78.3% probability to a 92.5% probability of taking the state.
In New Mexico, one old poll was replaced by a new (but small) poll that has Clinton up +4%. The previous poll had her at +9%. As a result, Clinton’s chances have dropped from 99.4% to 77.3% probability of winning the state now. The polling history suggests that Clinton is very likely to take New Mexico:

Two new polls, and the loss of an old poll in North Carolina have strengthened Clinton’s tenuous hold on the state. She now has lead in five consecutive NC polls, but the margins are small (+1%, +3%, +1%, +2.6% and +1%). Her chances have gone from 52.2% to 56.7%. Still, pretty much a tie.

In Pennsylvania we lose two polls and gain one new one. This has tightened the race slightly, but Clinton still has a 94.9% probability of taking the state. The polling history does suggest a tightening of the race, but Clinton leads the last 5 polls by small margins (+4%, +3%, +1%, +2%, +2%).

Virginia loses one poll and gains two new ones. Four days ago, Clinton had a 99.7% probability of winning. Today, she takes all but 28 of the 100,000 simulated elections.
The long term trends in this race can be seen from a series of elections simulated every seven days using polls from 03-Oct-2015 to 03-Oct-2016, and including polls from the preceding month (FAQ). As we’ve seen before, Clinton is on the move upward, after hitting a “low” that still had her most likely winning the election.
Note that the polls have yet to “speak” to Donald Trump’s other problems that arose after the debate—his 3am tweet about an Hispanic model (Alicia Machado) and her non-existent “sextape”, Trump’s own soft-core porn video, Trump’s suggestion that his opponent is cheating on her spouse, Trump’s partial 1995 tax forms showing over $900 million losses, the Trump Foundation’s potential legal problems, his badly-stated comment about Vets with PTSD, and a bunch of high profile newspaper non-endorsements. If these issues affect the polls, we’ll see the effects over the next week or two.
Of course, things may not continue to favor Clinton. Wednesday is supposedly the “October Surprise” that will un-do her.

An animated sequence of maps and electoral vote distributions can be seen here
Here is the distribution of electoral votes [FAQ] from the simulations:
Poll Analysis: Clinton’s lead holds for now
 |
 |
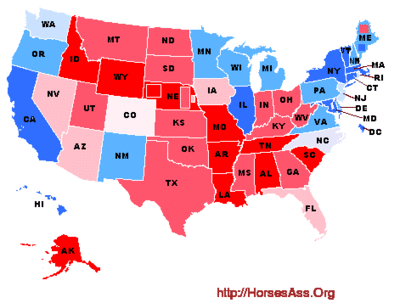

Since my previous analysis, nearly 50 new state head-to-head polls have been released in the match-up between Sec. Hillary Clinton and Donald Trump. (Actually, many more state head-to-head polls have been released, but they are based on internet samples, so they don’t qualify by the rules for poll inclusion.) The polls were all taken before and just up to the first debate on Monday night. Subsequent analysis will reveal what effect, if any, the first debate may have had on the race.
Today, after 100,000 simulated elections, Clinton wins 79,245 times and Trump wins 20,755 times (including the 1,915 ties). Clinton received (on average) 288 to Trump’s 250 electoral votes. In an election held now, Clinton would have a 79.2% probability of winning and Trump would have a 20.8% probability of winning. This is a tiny bump in probability (+0.3%) for Clinton relative to last week.
In Colorado, four new polls have been added that give a tiny bump to Trump. He went from a 48.8% chance last week to a 51.4% chance now. The state is, essentially, tied. The polling history, suggests a real change in Trump’s favor over the past three months.

New polls in Maine confirm what we already knew. Clinton would likely win now, but CD-1 would go to Clinton and CD-2 would go to Trump.
A new poll in Minnesota brings some certainty to that state. Clinton went from an 88% probability of taking the state last week to 95% this week.
We finally have our first polling for Nebraska’s congressional districts. NE-1 and 3 are solidly Trump. NE-2, which went for Obama in 2008, doesn’t look like it will split off from the rest of the state this election, with an 84% probability of going to Trump right now.
This week we gain three new North Carolina polls and lose two older ones. The three new polls favor Clinton, so the state has gone from 68.7% probability for Trump last week to a 52.2% chance for Clinton this week. North Carolina is tied.

With the loss of two, and the gain of three Ohio polls, Trump edges up from 90.3% to a 94.6% chance of taking the state.
Washington finally gets a new poll, and it is surprisingly close. The evidence suggests Clinton would only take the state now with an 87.7% probability. Even so, Trump has yet to win a Washington state poll.

Finally, Wisconsin loses two old polls and gains a new one. The race looks surprisingly close with Clinton dropping from an 98.4% to a 90.8% chance of taking the state. As with Washington, Trump has yet to win a Wisconsin poll. The race does seem to tighten up in recent weeks.

Here is the distribution of electoral votes [FAQ] from the simulations:
[Read more…]
Live Blogging the First Presidential Debate
Okay…the debate is about to begin. Have at it in the comment threads. I’ll post my nuggets of wisdom from the folks at Drinking Liberally and from Twitter.
[6:05] Opening topic: reducing income inequality in a period of low unemployment.
Clinton: Invest, invest, invest.
Drumpf: CHINA! CHINA! CHINA!
Trump claims that U.S. doesn’t have the largest, most sophisticated manufacturing facilities in the world. Ummm…Mr. Trump, ever hear of Boeing’s plant in Everett? Largest in the world.
TRUMP: THE WALL IS TO KEEP YOU IN
— LOLGOP (@LOLGOP) September 27, 2016
Ford is not leaving. Trump is lying #debatenight
— Cliff Schecter (@cliffschecter) September 27, 2016
[6:13] Drumpf, “The U.S. doesn’t know what it is doing” in manufacturing. Unbelievable!
[6:14] Drumpf is starting to fall apart already, with his little aside to Clinton.
[6:15] Drumpf’s import tax bring to mind Bill Murray’s famous SNL lounge skit: “Trade Wars / If they had made wars / Let there be trade wars / ooohhh oh yeah.
What's w/the sniffing #Trump? She hasn't even spanked you yet. #debatenight
— esd2000 (@esd2000) September 27, 2016
[6:19] Again and again, Drumpf tells us what we “have to do” without any concrete proposals.
[6:20] Clinton successfully holds off Drumpf’s attempt at disruption.
Trump is so good at deflecting the "how" questions. #debatenight
— Julian Gottlieb (@JulianGottlieb) September 27, 2016
[6:21] Hello? Moderators?
Here we go. Trump is losing control. He tried hard, but she is getting under his skin. #Debate
— Samuel Minter (@abulsme) September 27, 2016
.@realDonaldTrump is doing a masterful job running for Shouter In-Chief. #debatenight
— (((Goldy))) (@GoldyHA) September 27, 2016
[6:26]: Drumpf completely LOST IT! “No wonder you have been fighting ISIS your entire life.” ISIS didn’t even exist when she last held a government position.
Can't wait until Lester Holt shows up.
— Ken Rudin (@kenrudin) September 27, 2016
Baby has a lot of tantrums #DEBATES
— Sarah Silverman (@SarahKSilverman) September 27, 2016
Trump: "I'm going to bring back the jobs that left under Bush by giving rich people the tax breaks Bush gave them."#Debates2016
— Top Conservative Cat (@TeaPartyCat) September 27, 2016
Trump hasn't completed a sentence this whole debate. And he's not willing to let Clinton complete either.
— LOLGOP (@LOLGOP) September 27, 2016
Mr Trump, your two minutes: #debatenight pic.twitter.com/TYvZ7CUfCk
— Lizz Winstead (@lizzwinstead) September 27, 2016
Hillary: "You're just going to blame me for everything."
Trump: "Why not!?"An adult just said that on national television.
#debatenight— Rap Critic (@itstherapcritic) September 27, 2016
[6:33]: Drumpf has an audit conspiracy.
Trump calls Clinton "all talk." Let that sink in. #debates
— Sydney Brownstone (@sydbrownstone) September 27, 2016
[6:39]: “We spent 6 trillion dollars in the middle east” and we didn’t even take all of their oil….
[6:40]: Clinton may have used a private email server, but at least she paid her IT subcontractors.
Trump social media team deleted the tweet. The Internet never forgets you morons. pic.twitter.com/hXy10P5Asb
— Redeye (@PaulChaloner) September 27, 2016
[6:43]: Drumpf has calmed down, but is having trouble focusing.
[6:44]: Drumpf things Hillary is afraid to say “law and order”. WTF?!?
[6:48]: Drumpf is rattling off endorsements. What’s next, poll numbers?
[6:50]: Donald Trump wants to take guns away…from dark-skinned people.
[6:52]: Clinton makes a passionate argument for justice reform. Trump’s response, “she won’t law and order!” and “stop and frisk!”
It'll be VERY interesting to see if Trump gets crushed in the press for that Al Gore sigh.
— David Waldman (@KagroX) September 27, 2016
"we'll help them get off" – the best thing Trump has said all night #debatenight pic.twitter.com/AxHQUZssBS
— Grace Parra (@GraceParra360) September 27, 2016
[7:00]: Dear @realDonaldTrump Obama produced the standard Hawaii birth certificate in 2008.
Trump on being fined for racial discrimination: “it’s just one of those things.”
— Matthew Yglesias (@mattyglesias) September 27, 2016
OMG, the only thing worse than a "I have a black friend" answer is "I let them into my private club."
— Justin Wolfers (@JustinWolfers) September 27, 2016
[7:12]: DJT uses “Cyber” incorrectly. Clearly new to the word. Norbert Weiner spins in his grave.
[7:15]:Drumpf blames Obama/Clinton for leaving Iraq. You know…the withdrawal that was set up by Bush’s failure to come to an agreement with Iraq.
[7:22]: At the end of a crazy, defensive tyrade, “I have better judgement than her.”
[7:24]: Trump is sniffling a lot. Is he well enough to be President?????????
[7:26]: Clinton’s “caviler attitude about nuclear weapons” segment was potent.
[7:27]: Holy shit. @realDonaldTrump understanding of defending other countries amounts to gangster movies.
The Esquire article to which Trump refers was not "right after" the war. It was 17 months after the war.
— Daniel Dale (@ddale8) September 27, 2016
Here's a 3-minute explanation on how Bush,not Obama, created Isis by @Thom_Hartmann https://t.co/37WZ4sD7hK #debatenight #CrashingTheParty
— Danielle Guilday (@DanielleOnRadio) September 27, 2016
Everyone should read this. https://t.co/Ire1HfUuzS
— Chris Cillizza (@TheFix) September 27, 2016
[7:33]: Clinton’s strategy: say something clear. Let Drumpf babble.
[7:35]: No shit on Clinton’s statement on stamina. Look at her freaking schedule while SOS! Brutal travel and meeting schedule.
Friday Night Multimedia Extravaganza!
Roll Call: Government shutdown looms.
Stephen with Michelle Obama: Imitating Barack.
Keith Olbermann interviews Press Sec. Josh Earnest on the debate and the stakes of the race: PART I and PART II.
Kimmel on presidential debate topics.
The 2016 Racist, Sexist, Homophobic, All-Around-Great-Hater Clown Show:
- Mark Fiore: Gloater-in-Chief
- Samantha Bee: Master Media Baiter
- Sam Seder: Drumpf African-American town hall (with Hannity!), “We need more stop & frisk!
- Kimmel: Drunk Donald Drumpf—Mosquitos
- PsychoSuperMom: (Trump’s) Addicted To Lies
- The Donald Drumpf supporter Apple commercial:
https://youtu.be/4ZFVPBXB4Zo - Red State Update: Drumpf says Obama was born in America
- Keith Olbermann: The real secret behind Drumpf’s terrorism plan.
- Young Turks: Drumpf v. Scientists
- Jimmy Dore: Donald Drumpf pursues Black votes in front of all-White crowd
- Chris Hayes: Drumpf debate prep
- Stephen Colbert: A Black Republican insists Donald Drumpf is great for business
- Kimmel: Drunk Donald Drumpf—Balcony
- Drumpf has advice for Angelina Jolie. His next wife?
- Young Turks: Drump’s misogyny is target of Clinton ad.
- Sam Seder: Racist Drumpf campaign Chair says there was no racism “until Obama got elected”
- Stephen: You should definitely take the Donald Drumpf debate prep survey
- Keith Olbermann: Trump supporters are now blaming their racism on Obama
- Young Turks: Drumpf’s brilliant outreach to African American communities, “stop and frisk”.
- Matthew Filipowicz: The real reason the cop union endorsed Drumpf.
- Keith Olbermann: The most deplorable thing Drumpf has done yet.
- Samantha Bee: Too close for comfort.
- Seth Meyers: A Closer Look at new questions about Drumpf’s Foundation
- Young Turks: Trump Jr: Syrian refugees are just like skittles
- Jimmy Dore: Jr’s Skittles tweet rooted in early Nazism
- Conan releases Drumpf’s other Candy-related ads
- Trevor Noah: Donald Drumpf is a bowl of poisoned Skittles
- Stephen: Jr. might want to check his math:
- Kimmel: Drunk Donald Drumpf—Hello
- Daily Show: Jordan Klepper Fingers the Pulse — Conspiracy theories thrive at a Drumpf rally
Adam Ruins Everything: Trophy hunting can be good for animals?
Samantha Bee: Chief Executive fear mongerer: PART I and PART II
Kimmel: Unnecessary Censorship—Obama Edition.
Stephen with Michelle Obama on political spouses.
Hillary Makes History:
- Stephen: Hillary Clinton preps for two Drumpfs at the debate
- Jimmy Fallon with Sec. Clinton: Kids’ letters
- Jimmy Fallon with Sec. Clinton: Hillary Clinton on her health and recovery from pneumonia
- Jimmy Fallon with Sec. Clinton: Breaking barriers, fighting bigotry and debating Drumpf
- Jimmy Fallon with Sec. Clinton: Balancing seriousness with positivity as a woman
- Between Two Ferns with Sec. Hillary
Secret Service won’t let Stephen see FLOTUS.
Thom: Open source voting explained.
Samantha Bee: The week in HUH? Super delegate-lobbyists.
Susie Sampson: Picking between gays and Muslims.
This @BillBryantWA interview plays like a Daily Show segment but w/out the jokes. Worst. Candidate. Ever.https://t.co/KeoJnqytMb @Q13FOX
— (((Goldy))) (@GoldyHA) September 23, 2016
Mel Brooks pranks Obama.
Thom: Here’s who’s being eliminated from the voter roles.
Mental Floss: 31 weird discontinued products.
John Oliver: The refugee crisis.
Sam Seder: OMG! Christie knew about Bridgegate.
This Week in Cops Killing Black People:
- Young Turks: Charlotte victim’s wife posts her phone footage
- Jimmy Dore: Killer cops get rich more than they get punished
- Trevor Noah: Terence Crutcher’s police shooting & racial bias in America
- Young Turks: Tulsa officer Betty Shelby charged with manslaughter of Terence Crutcher
- Jimmy Dore: Unarmed, disabled Black man killed by police
- Stephen: The State of Emergency in Charlotte
- Jimmy Dore: Police shoot Black man when his car breaks down
- Young Turks: USA Today Columnist on protesters, “Run them down”
-
Everybody loves autumn. In #Charlotte, the police are using tear gas with just a hint of pumpkin spice. #Nascar #HallOfFame #RealTime pic.twitter.com/SmLEMb3TWS
— Bill Maher (@billmaher) September 24, 2016
- Conan with Marshawn Lynch on the Colin Kaepernick controversy.
- Young Turks: Black woman paints herself white to make a point.
White House: West Wing Week.
Jimmy Dore: Reince Priebus worn out after months of turd-polishing:
Sam Seder: NC Rep. says Charlotte protesters “Hate White people because White people are successful & they’re not”.
Taco Truck Guy on typical Mexicans.
Bill Maher with a New Rule: Bring civility back to politics.
Last week’s Friday Night Multimedia Extravaganza can be found here.
Poll Analysis: Senate still red, but Democrats chip away

The Democrats would still be unlikely to take the Senate in an election held today. Nevertheless the Republicans have lost ground since the previous analysis. Ten days ago Democrats had an 11.8% chance of taking the Senate. Today their chances are nearly 30%.
After 100000 simulated elections, Democrats have a Senate majority 4934 times, there were 24613 ties), and Republicans control the Senate 70453 times. Democrats have a 29.5% probability of controlling the Senate and Republicans have a 70.5% probability of controlling the Senate. This analysis assumes that the Vice President will be a Democrat.
Here is the distribution of Senate seats from the simulations:*

This graphs shows the probability of at least each number of seats controlled by the Democrats:*

- 100000 simulations: Democrats control the Senate 29.5%, Republicans control the Senate 70.5%.
- Average ( SE) seats for Democrats: 49.0 ( 1.0)
- Average (SE) seats for Republicans: 51.0 ( 1.0)
- Median (95% CI) seats for Democrats: 49 (47, 51)
- Median (95% CI) seats for Republicans: 51 (49, 53)
Expected outcomes from the simulations:
- Democratic seats w/no election: 35
- Independent seats w/no election: one
- Republican seats w/no election: 30
- Contested Democratic seats likely to remain Democratic: nine
- Contested Republican seats likely to remain Republican: 20
- Contested Democratic seats likely to switch: one
- Contested Republican seats likely to switch: four
This table shows the number of Senate seats controlled for different criteria for the probability of winning a state:* Safe>0.9999, Strong>90%, Leans>60%, Weak>50%
| Threshold | Safe | + Strong | + Leans | + Weak |
|---|---|---|---|---|
| Safe Democrat | 43 | |||
| Strong Democrat | 3 | 46 | ||
| Leans Democrat | 3 | 3 | 49 | |
| Weak Democrat | 0 | 0 | 0 | 49 |
| Weak Republican | 1 | 1 | 1 | 51 |
| Leans Republican | 0 | 0 | 50 | |
| Strong Republican | 7 | 50 | ||
| Safe Republican | 43 |
This table summarizes the results by state. Click on the poll number to see the individual polls included for a state.
| # | Sample | % | % | Dem | Rep/th> | ||
|---|---|---|---|---|---|---|---|
| State | @ | polls | size | Dem | Rep | % wins | % wins |
| AL | 0 | 0 | (0) | (100) | |||
| AK | 0 | 0 | (0) | (100) | |||
| AZ | 2 | 1389 | 45.2 | 54.8 | 0.5 | 99.5 | |
| AR | 2 | 1142 | 36.9 | 63.1 | 0.0 | 100.0 | |
| CA | 3 | 1966 | 62.8 | 37.2 | 100.0 | 0.0 | |
| CO | 3 | 1377 | 55.0 | 45.0 | 99.5 | 0.5 | |
| CT | 1 | 872 | 61.7 | 38.3 | 100.0 | 0.0 | |
| FL | 8 | 4619 | 46.6 | 53.4 | 0.0 | 100.0 | |
| GA | 6 | 2849 | 40.5 | 59.5 | 0.0 | 100.0 | |
| HI | 0 | 0 | (100) | (0) | |||
| ID | 0 | 0 | (0) | (100) | |||
| IL | 2 | 1023 | 52.0 | 48.0 | 81.1 | 18.9 | |
| IN | 1 | 504 | 52.4 | 47.6 | 77.2 | 22.8 | |
| IA | 4 | 2294 | 44.4 | 55.6 | 0.0 | 100.0 | |
| KS | 1 | 495 | 40.4 | 59.6 | 0.2 | 99.8 | |
| KY | 1& | 440 | 43.2 | 56.8 | 2.1 | 97.9 | |
| LA | 1 | 794 | 34.6 | 65.4 | 0.0 | 100.0 | |
| MD | 2 | 1019 | 68.6 | 31.4 | 100.0 | 0.0 | |
| MO | 3 | 2530 | 47.2 | 52.8 | 2.6 | 97.4 | |
| NV | 5 | 2843 | 48.3 | 51.7 | 9.3 | 90.7 | |
| NH | 6 | 3450 | 49.8 | 50.2 | 43.5 | 56.5 | |
| NY | 1 | 671 | 72.1 | 27.9 | 100.0 | 0.0 | |
| NC | 9 | 6027 | 48.8 | 51.2 | 9.0 | 91.0 | |
| ND | 0 | 0 | (0) | (100) | |||
| OH | 7 | 4656 | 42.0 | 58.0 | 0.0 | 100.0 | |
| OK | 0 | 0 | (0) | (100) | |||
| OR | 1 | 403 | 55.1 | 44.9 | 92.5 | 7.5 | |
| PA | 7 | 4143 | 50.8 | 49.2 | 78.3 | 21.7 | |
| SC | 1& | 941 | 38.4 | 61.6 | 0.0 | 100.0 | |
| SD | 0 | 0 | (0) | (100) | |||
| UT | 1& | 678 | 27.9 | 72.1 | 0.0 | 100.0 | |
| VT | 1 | 544 | 62.3 | 37.7 | 100.0 | 0.0 | |
| WA | 1& | 430 | 60.5 | 39.5 | 99.9 | 0.1 | |
| WI | 6 | 3830 | 55.2 | 44.8 | 100.0 | 0.0 |
@ Current party in office
& An older poll was used (i.e. no recent polls exist).
*Analysis assume that the two independent candidates will caucus with the Democrats.
Details of the methods are given in the FAQ.
Poll Analysis: New gains for Trump
 |
 |
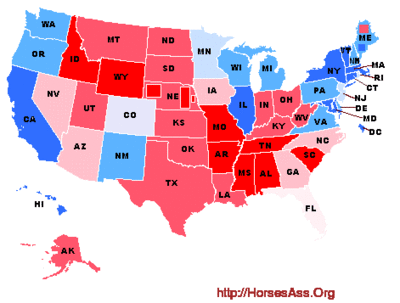

Last week’s analysis had Sec. Hillary Clinton leading Donald Trump 309 EVs to 229 EV, and gave Clinton a 96.2% chance of winning an election held then.
About 25 new polls have been released since then, and Trump has made further gains. Now, a Monte Carlo analysis of head-to-head polls gives Clinton 78,889 wins and Trump 21,111 wins (including the 2,468 ties) out of 100,000 simulated elections. Clinton received (on average) 288 to Trump’s 250 electoral votes. In an election held now, Clinton would have a 78.9% probability of winning and Trump would have a 21.1% probability of winning.
Here are a few notes for individual states.
There isn’t a lot of good news for Clinton, but in Arizona, an old Trump+5% poll aged out, leaving a series of much closer polls. Consequently, Trump’s probability of winning the state has dropped from 92.5% to only 80.5%.
Something similar has happened in Florida. A clear outlier poll with Clinton up +14% has aged out, and we have two new polls. The tally has Clinton leading 3 and Trump leading 3 with one tie. The net result is that we went from Clinton with a 82% probability of taking the state last week to a 59% chance of Trump taking the state this week. Florida is a toss-up.
In Maine a new SurveyUSA poll gives us verification that Maine’s 2nd CD is strongly for Trump, while the 1st CD is strongly for Clinton. The CDs would split in an election held now. Overall, however, Clinton would take the state.
A new Mason-Dixon poll in Minnesota has Clinton at +6% over Trump. Still, the small size of the poll means that Clinton’s chances are pegged at 88%. The longer polling history suggests Clinton would easily take the state.

Nevada has flipped. We have five current polls, and Trump has small leads in the last four polls. Last week we gave Clinton a 63% chance of winning Nevada. Now Trump has a 68% chance. Clearly, Nevada is a swing state.

North Carolina has flipped as well. Clinton had a tenuous lead last week, with a 58% chance of taking the state. With three new polls that all go to Trump, the GOP nominee now has a 69% chance of winning the state.

Ohio has strengthened for Trump on account of a new Trump+5% poll. Trump has led in the past 5 polls, raising his chances from 78% last week to 90% this week.

The long term trends in this race can be seen from a series of elections simulated every seven days using polls from 22 Sep 2015 to 22 Sep 2016, and including polls from the preceding month (FAQ).

Trump is now in his strongest position of the entire election cycle, even though his chances of winning are about 1 in 5. This change reflects what we have seen in the national polls a week or two ago. Since these analyses rely on state polls, there is a lag as new polls come in and old polls drop out. The next week will be interesting to see if and where Trump “maxes out”, as Clinton seems to be recovering from her bad streak of national polls.
An animated sequence of maps and electoral vote distributions can be seen here
Here is the distribution of electoral votes [FAQ] from the simulations:
Poll Analysis: Trump Makes Gains
 |
 |

I’m buried this week, so this report will be brief. Let me first mention that I usually send out Tweets from @hominidviews with each poll I add to the database, and include a graph of the recent polling for the state. I also announce new analyses there, and sometimes offer quick previews when I don’t have time to do a full analysis. So follow me at @hominidviews for these updates.
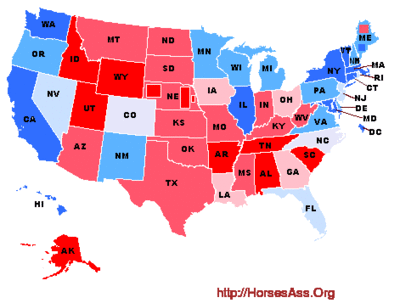
Last week Donald Trump had made small gains over Sec. Hillary Clinton. Plenty of new polls have come—about 35—and many of these polls were conducted during at least part of Clinton’s “bad week.” Not surprisingly, Trump makes gains.
After 100,000 simulated elections, Clinton wins 96,242 times and Trump wins 3,758 times (including the 702 ties). The previous analysis had Clinton winning almost 100% of the simulated elections. In an election held now, Clinton would have a 96.2% probability of winning and Trump would have a 3.8% probability of winning.
Clinton received (on average) 309 to Trump’s 229 electoral votes. This is substantially down from the 340 Clinton had last week, but still above the 270 threshold needed to win.
Here is the distribution of electoral votes [FAQ] from the simulations:
[Read more…]
Poll Analysis: Senate Prognosis

An analysis of state head-to-head polls in Senate races suggests that Republicans would most likely control the Senate if the election was to be held today. Democrats have made small improvements since my previous analysis in July.
After 100000 simulated elections, Democrats have a Senate majority 1239 times, there were 10566 ties), and Republicans control the Senate 88195 times. Democrats have a 11.8% probability of controlling the Senate and Republicans have a 88.2% probability of controlling the Senate. This is only up slightly from the previous analysis. Where Democrats have gained is in the number of expected seats, going from 48.2 (on average) to 48.5. The median number of seats remains at 48.
A few states warrant comment.
The Arizona race has gone in Sen. John McCain’s (R) favor. He was at a 76% chance in July; now he is nearly at 100%. That said, the polling show great variability, so Democrat Ann Kirkpatrick may not be down for the count just yet.

Nothing has changed in Illinois, in the seat held by Republican Mark Kirk. Democrat Tammy Duckworth only has a 38% chance of winning, but the polling is old and (possibly an outlier). Illinois may well be a pick-up, but we don’t have good, recent polling to say so.

Last July, U.S. Representative Baron Hill (D) withdrew from the Indiana Senate race to make room for former U.S. Senator Evan Bayh (D). That changed the nature of the race. The state is now widely considered a Democratic pick-up.
Missouri was nearly a toss-up in July. Now it is solid for Republican Roy Blunt. Democrat Jason Kander only wins 22 the 100,000 simulated elections.

In Nevada, Democrat Catherine Cortez Masto was leading Republican Joe Heck with a 67% probability of winning in July. Alas, the polling since then has favored Heck, and the Republican now has a 91% of winning an election now. Still, most of the polls are extremely close.

New Hampshire’s incumbent Republican Kelly Ayotte has been in the fight for her life against Democrat Maggie Hassan. In July, the race was tied up. And, the fact is, Hassan leads in most polls. But one strong recent poll gives Ayotte the edge with a 78% probability of winning right now.

In Ohio, Democrat Ted Strickland has been slowly losing ground to incumbent Sen. Rob Portman (R). The graph says it all:

Pennsylvania was red in the previous analysis. But Sen. Pat Toomey (R) has been slipping to Democrat Katie McGinty, and the Democrat now has an 87% chance of winning now.

Here is the distribution of Senate seats from the simulations:*
Poll Analysis: Trump gains very slightly
 |
 |
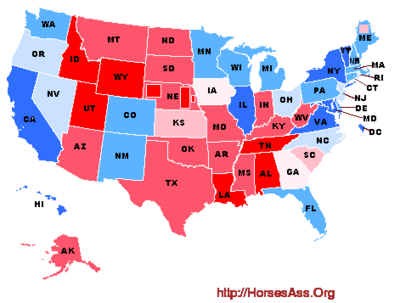

There have only been 18 new polls since the analysis last week. (Actually, there have been a flood of polls done using internet panels, but I still refuse to include those polls.) Most notible among the polls is an Emerson poll from Maine that includes sub-polls for Maine’s two congressional districts. This is only the second pollster providing the CD breakdowns, and both have found the state split.
Now, after 100,000 simulated elections, Sec. Hillary Clinton wins 99,991 times and Donald Trump wins 9 times. Clinton received (on average) 340 to Trump’s 198 electoral votes. In an election held now, Clinton would have a greater than 99.9% probability of winning and Trump would have less than 0.1% probability of winning. This is Trump’s best performance in months.
Over the past week, we have seen the national polls tighten up a bit. Even though most polling is done in swing states, it still takes some time for analyses based on state head-to-head polls to catch up with national polling. We should expect to see a shift toward Trump.
That said, the electoral map is still strongly favoring Clinton. It is difficult, right now, to see a path for Trump to achieve 269 EVs.
Here are a few state notes.
Georgia had five current polls for the previous analyses, but four have “aged-out” and now we have one current poll. As a result, the state has gone from 50.1% probability of Clinton taking the state to 52.7% for Trump. In other words, the state is still a dead tie.

In Iowa, one poll has aged out and two new polls have been added, one with Clinton up +2% and one with Trump up +5%. The net result is that Iowa has moved from 56.4% probability of Clinton winning the state in the last analysis to a 51% probability of Trump taking the state now. It is a toss-up.

The new Maine poll has moved Clinton chances of winning the state from 100% down to a 97.3% probability. Clinton’s chances in Maine’s 1st CD has gone from 97% to 99.9%. And in Maine’s 2nd CD, Trump’s chances have gone from 54% to a 76.2% probability of taking the state now.
This week we lose one Missouri poll and gain a new one with Trump up +9%. The net result is that the state goes from Trump winning with a 93.9% probability to a 99.6% probability of taking the state.
We have no new polls in Nevada this week, but one poll has aged out, moving Nevada from an 84.1% chance for Clinton to a 64.3% chance.
A surprisingly close new poll in New Jersey suggests that Trump has a 21.8% chance of taking the state. That said, Clinton has won every NJ poll to date.

In Ohio, two of last week’s five polls age out. This has moved Clinton’s chances down from 90% to an 82% chance of taking the state.

A new Rhode Island poll is surprisingly close. Trump now has gone from almost no chance of taking the state to a 30% chance. Still the polling overall favors Clinton.

Here is the distribution of electoral votes [FAQ] from the simulations:
[Read more…]
Poll Analysis: Race is stable with Clinton leading Trump
 |
 |
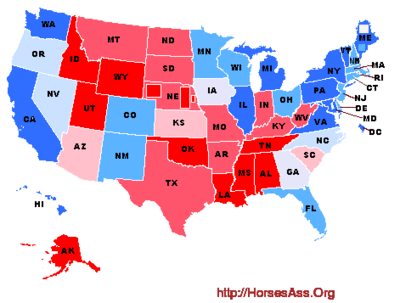

We now have about 20 new polls since the previous analysis last week. There Sec. Hillary Clinton was leading Donald Trump in mean electoral votes 347 to 199. If the election had been held last week we would expect Clinton to win with near certainty.
The new polls come largely from swing states, and include: 2 AZ, 1 FL, 1 MI, 1 MO, 2 NC, 1 NH, 1 NY, 2 OH, 4 PA, 1 VA, 4 WI, and 1 WV.
A Monte Carlo analysis with 100,000 simulated elections, gives Clinton all 100,000 wins. Clinton received (on average) 350 to Trump’s 188 electoral votes. In an election held now, Clinton would be expected to win with greater than 99% probability.
Basically, the newest polls don’t change the picture much. The only state to flip is Georgia, that went from Trump with a 72.5% probability of taking to state to Clinton with a 50.1% chance. In other words, Georgia looks like a toss-up. The change isn’t because of new polling. Rather, one old poll “dated out”. Frankly, Clinton’s standing is being driven by one poll from JMC Analytics that has her up +7%. I suspect this poll is an outlier.

In Missouri, a new PPP poll has Trump up +6%, which improve his chances of taking the state from 79.4% last week to 93.9% this week.

In North Carolina we lost one old poll and gained two new polls. The net result is no change: Clinton still has an 84% chance of taking the state now.

Here is the distribution of electoral votes [FAQ] from the simulations:
[Read more…]
Poll Analysis: Clinton gains electoral votes
 |
 |
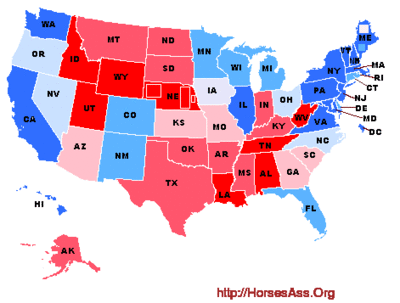

The previous analysis showed Sec. Hillary Clinton with nearly 100% probability of beating Donald Trump in an election held last week. Her average Electoral College total was 337 to Trump’s 201.
Since last week’s analysis, there have been 22 new polls released in 16 states. We have three new polls in North Carolina, two in Florida, a pair in Michigan, and two in Virginia. Note that I did not include a recent poll from South Carolina because it was commissioned by the state Democratic Party. I explain my inclusion and exclusion criteria for polls in the FAQ.
After 100,000 simulated elections, Clinton wins all 100,000 times. This time, Clinton received (on average) 347 to Trump’s 191 electoral votes. In an election held now, Clinton would have a very close to a 100% probability of beating Trump.
Clinton is now in an extremely strong position. Even if she wins only the “safe Clinton” and “strong Clinton” states (i.e. darkest shades of blue) and loses all of the states that “lean Clinton” or are “weak Clinton” (i.e. medium or light shade of blue), she wins the election with 294 electoral votes. That is, Clinton still wins the election without Iowa, Nevada, North Carolina, Oregon and Ohio. I should add that nobody seriously expects Clinton to lose Oregon; the most recent poll we have in the state is from mid-June, and has Clinton leading Trump by a few points.
A few things have changed since last week that bumps up Clinton’s electoral vote total.
In Iowa and old Docking poll aged out and a new poll was released giving us three current polls. The newest has Clinton up by +2%, one has Trump up by 1.2% and the third is a dead tie. The net result is that Clinton won 57.2% of the simulated elections suggesting she is slightly favored, but statistically, Iowa is a tie.

In Missouri we lose two old polls, including one with Trump up by +9.9%. The three current polls have Trump up: +1%, +2% and +3%. As a result, Trump dropped from a 91% to a 84% chance of winning the state.
For the previous analysis we only had an old poll for New Mexico that had Clinton up by about 3%. But a new PPP poll in the state has Clinton up 40% to 31% (+9%). Consequently Clinton moves from a 76% probability of winning the state last week to a 99% this week.
North Carolina moves to a lighter shade of blue this week. Last week we had three current polls with Clinton up by +9% and +2% and Trump up by +4%. Three new polls are added this week that has Clinton up +2%, Trump up +10%, and a tie. The net result is that Clinton went from a 91% probability of winning the state last week to an 84% chance of taking it this week.

Here is the distribution of electoral votes [FAQ] from the simulations:
[Read more…]
The fake polls have arrived!
There is a new Pennsylvania poll released today that has Trump leading Clinton 41.9% to 36.5% from a random sample of 1000 registered voters. The poll is released by a Canadian consulting firm that specializes in something like project management in the petroleum industry.
The poll is almost certainly fake, and without further information, it will not be included in my database of polls. It isn’t just the surprising results (Clinton has been leading Trump handily in PA for some time now) that leads me to exclude it. Rather it is what the “pollster” writes that flags this as a fake. The alternative is that the press release has been written by a rank amateur who has completely botched the description of the poll and, perhaps, the results.

At this point, I invite you to join me in some wonky fisking of the poll press release. Let’s start with the methods:
The survey is designed to use a scientific method to provide results which are as much as possible representative of the actual voter population with minimal distortion of results.
It uses “a scientific method”? Really! Don’t all polls? Real pollsters don’t say shit like this. Rather, they might mention using standard polling methods or some such thing. Most simply describe their methods without fanfare.
Adults 18 years of age and older registered voters residing in the state of Pennsylvania were contacted on landline numbers and interviewed in English using robo-call interviewers.
Nevermind that PA isn’t a state (it is a commonwealth). But “using robo-call interviewers” is rather informal for a description of methods. Inclusion of the word “interviewers” suggests sloppiness or ignorance of what a robo-poll is. “Using robo-call interviews”, perhaps. “Interviewers,” no.
Landline telephone numbers were randomly selected based upon a list of registered voters from throughout the state of Pennsylvania from reputable suppliers of random phone numbers to opinion research companies.
First, this is a very badly written sentence–a theme throughout the press release. But…”suppliers” in the plural? They needed more than one supplier of phone numbers for Registered voters? Who were they, and how did they get voter’s phone numbers to match up with the voter registration?
Samples generated are as close to truly random as possible.
No they weren’t. This sounds entirely like a non-statistician trying to sound technical. Nobody with real training in polling methods or statistics would make such an idiotic statement. First, nobody (particularly a real pollster) truly believes that samples in political polls are all that close to random, and (2) one could always find better (costlier) methods to draw samples that are closer to random.
The phone numbers were selected to ensure that each region was represented in proportion to its population.
Again, this seems suspect and amateurish in wording and from the lack of specifics. No regional breakdown was given in the results.
The questions asked during the Robo-call survey was kept extremely simple to minimize any distortion to the response due to: Framing of the questions, communication issues, distractions and the consequent impact on the interpretation and response.
Poorly written, bad grammar, and partially nonsensical. At this point, let me say that this could all be a function of a bad press release writer.
The questions asked were as follows: “Who will you vote for in November Presidential Elections?- Press 1 for Donald Trump. Press 2 for Hillary Clinton. Press 3 for Neither.”
That would be only one question, not “questions”. If this is truly the only question asked, then the poll results are fake, given that age and income questions must have been asked as well.
the sample was balanced based on the 2014 Pennsylvania Census
Only problem…there was no “2014 Pennsylvania Census”. There are population estimates for 2014 in PA, but these are based on the 2010 census. A knowledgeable writer might say, “based on 2014 population estimates for PA” or some such thing, but would never say “based on the 2014 PA census.”
This survey excluded the various counteracting variable factors to provide a more representative ground reality without complicating it with the said factors. These variable factors, inter alia consist of: In-State / Out-of-State migration, transients, people without landlines or cell phones, racial demographic representation at the polling booth. Another counter-acting set of variables is turnout: among young people, people who have never voted before, increased/decreased turnouts compared to previous elections. These factors are in a state of continual flux at this dynamic stage of the election process. It is not feasible to accurately include the impact of these factors without introducing unintended distortion in the outcome.
This is largely gobbledygook.
Note that both principals listed for this organization have Indian surnames, and this press release does have some elements of Indian English. I’ve spent a lot of time in S. Asia and working with Indian scientists and statisticians over the years, so I can say with some certainty that the errors, sloppiness, ambiguity and amateurishness of this press release are not a function of it being written in Indian English.
Results are statistically significant within ±7.1 percentage points, 19 times out of 20.
The “19 times out of 20” is an okay way of saying “at the 5% level”, but there is a problem with the margin of error (MOE) of 7.1%. The sample size is 1000, which makes 7.1% absurd for the MOE.
Pollsters find the 95% MOE as ±1.96*sqrt[p*(1-p)/N], where N is the sample size, p is the proportion for one candidate and (1 – p) for the other. Usually, pollsters find the maximum MOE by assuming there really is a tie (i.e. 0.5 for each candidate), so our equation becomes ±1.96*sqrt(0.25/N). Substituting in 1000 for N the MOE should be about ±3%, not ±7.1%.
Earlier in the press release was the statement:
According to CEPEX analysis, the error percentage is high due to the results obtained from just one day of polling. Subsequent polling would be required to reduce the error percentage.
This statement either betrays this as fraud or, perhaps, the press release writer is totally ignorant of statistical methods, sampling error and the like. The fact that it was only one day of polling is completely irrelevant. The MOE is simply based on the sample size (and the assumptions of a binomial process). It doesn’t matter whether 1000 people were asked in one hour or one week. On the other hand, this all might be an awkward way of saying that they could only squeeze in 1000 phone calls in a single day.
That’s it for methods, which can be criticized on other grounds as well (no cell phone subsample, no randomization of candidate order, registered instead of likely voters, etc.).
The results have some “funny” things in them as well.
They have 10 age categories. It is certainly possible that their polling robot would ask for direct age entry. So…okay, but what happened to 18-29 year-olds? It looks like the youngest age category starts at 30.
So much for their “random sample” of voters in Pennsylvania.
For income, they have an astonishing 15 categories. Political pollsters never ask for household income directly, only in rough categories. People are highly reluctant to give their income over the phone in a political survey. But pollsters do get reasonable compliance when asking about income in a small number of broad categories.

The fact is, no real election poll would ever ask about income in 15 categories. There are several reasons, particularly for robo-polls:
- It simply takes too long to read through all these categories
- There are only 10 digits + 2 symbols on the touchtone pad, so 12 categories would be the maximum. One key would be needed for a “read them again” response so that means 9 (or maybe 11 using symbols) categories could be the maximum realistic number of categories
- Too many categories reduce compliance because the income categories become too small. That is, as you increase the number of categories, it feels more and more like asking income directly.
The number of income categories alone suggests very strongly to me that this is a fake poll.
I took a quick look at the Waybackmachine for the URL, and it only has an archive from 2am today. I suppose it could be a brand new URL they moved to today, but given all the other issues”, it sure looks like a fake poll.
A couple of months ago, I was thinking about the incentives and disincentives for a campaign to set up a series of fake polls. If you believe that inertia can make a difference, then there are some good incentives for doing this.
This poll may be our first such specimen–if so, it is very badly done. In the future, they may be much more difficult to uncover.
Poll Analysis: Clinton Gains
 |
 |
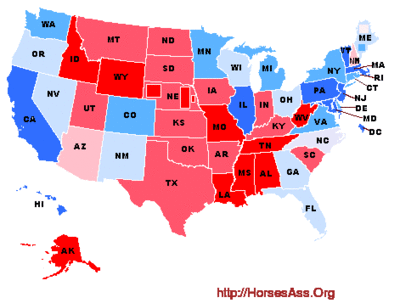

The previous analysis showed Hillary Clinton leading Donald Trump by an average of 309 to 229 electoral votes, giving Clinton a 97% probability of winning an election held then.
There have been 33 new polls released since then, many of them from electorally “interesting” states. So now, after 100,000 simulated elections, Clinton wins 99,315 times and Trump wins 685 times (including the 169 ties). Clinton received (on average) 325 to Trump’s 213 electoral votes. In an election held now, we would expect Clinton to win with a 99.3% probability and Trump with a 0.7% probability.
A number of states are worth examining in more detail.
Florida has a couple of new polls and three polls that “aged out” from the last analysis. One poll has the candidates tied up, and the other has Clinton up +4.4. The net result is that Clinton’s probability of winning has gone from 37% to 67%. This is still very nearly a tie, but the state moves from light red to light blue.
The raw polling results paint a picture of a state that “swings.”

Poll Analysis: Clinton still leads Trump
 |
 |
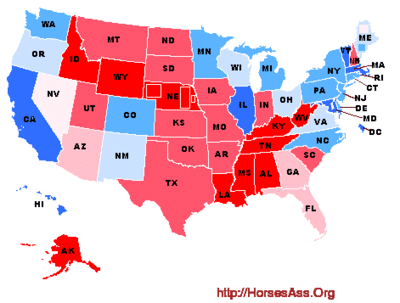

There have been eight new polls released since last week’s analysis, including PA, VA, NV, a pair in GA and a pair in AZ. The previous analysis had Hillary Clinton with a 97.8% probability of winning and election then. Donald Trump had a 2.2% of winning.
This week, after 100,000 simulated elections, Clinton wins 97,010 times and Trump wins 2,990 times (including the 459 ties). Clinton received (on average) 309 to Trump’s 229 electoral votes. In an election held now, Clinton would have a 97.0% probability of winning and Trump would have a 3.0% probability of winning.
There aren’t many changes with only eight polls in six states, but a few are worth noting.
In Arizona, three polls have aged out and there are two new polls, one with Clinton up +2 and the other with Trump up +7.5. The net is a small bump for Trump. This is similar in Georgia, where two new polls (Trump +0.2 and Trump +3) join an existing poll (Trump + 2) to boast Trump’s chances in the state.
We have one new poll in Nevada (Clinton +1) that, combined with two existing polls (Trump +5 and Clinton +4), bumps Clinton’s chances. Trump went from 68% probability down to a 59% probability. Essentially, Nevada is a tie.
Finally, Virgina has one new poll (Trump +4) with three existing polls (Clinton +5, Clinton +7, Trump +0.4). Clinton’s probability has dropped slightly from 94% to 82%.
Here is the distribution of electoral votes [FAQ] from the simulations:
[Read more…]
- « Previous Page
- 1
- …
- 17
- 18
- 19
- 20
- 21
- …
- 96
- Next Page »
