HorsesAss.Org

  • Home
  • About HA
  • Advertise
  • Archives
  • Donate

Search Results for: 10,000

Garbage In, Garbage Out: Are Republican “Pollsters” Gaming Poll Aggregators with Bullshit “Polls?”

by Goldy — Monday, 11/7/16, 4:37 pm

screen-shot-2016-11-07-at-4-12-41-pm

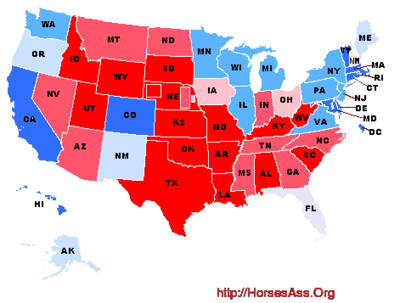
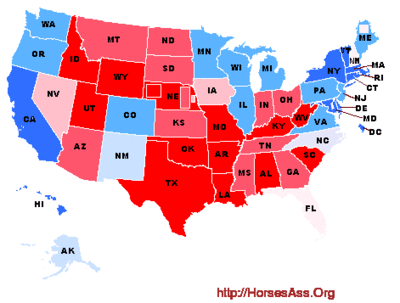
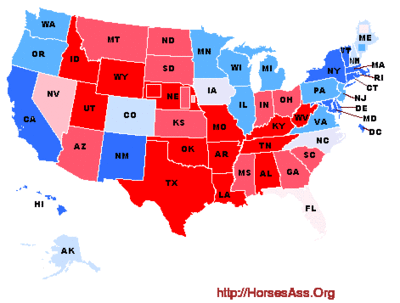
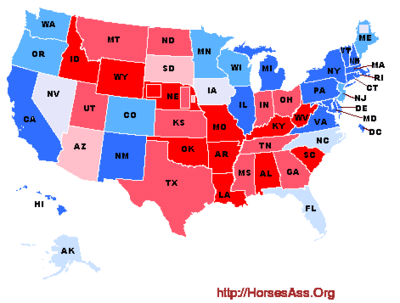
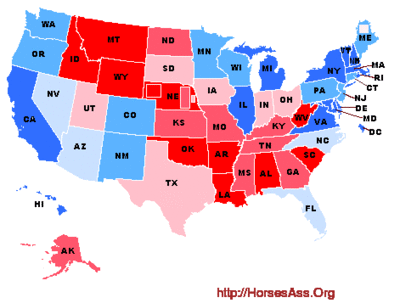
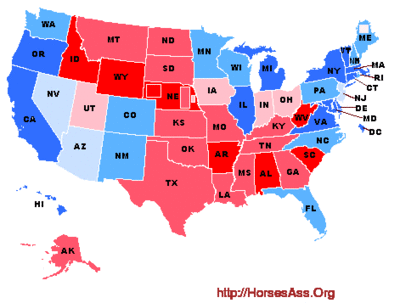
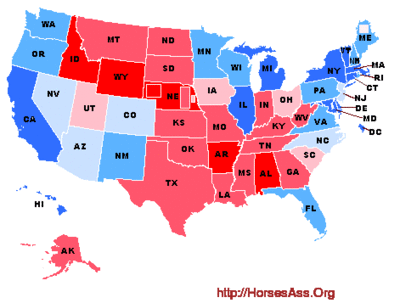
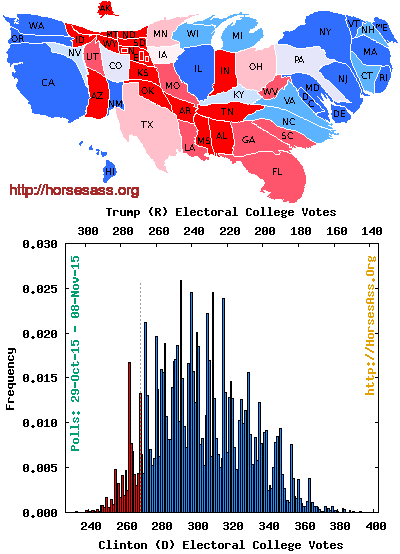
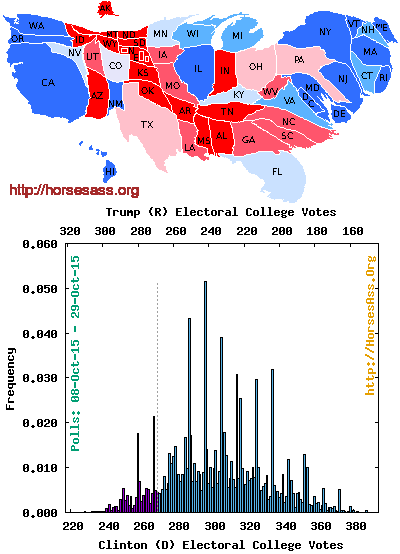
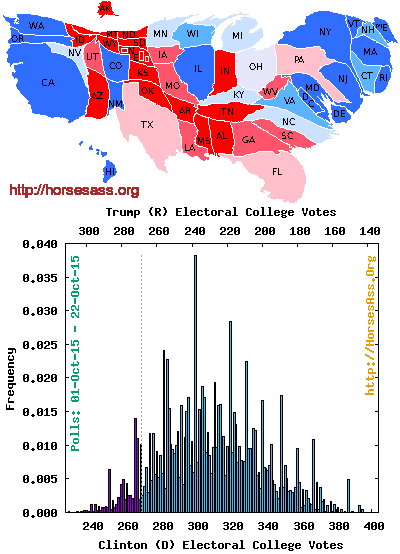
There’s been a lot of bedwetting in recent days over a flood of new polls that threatened to undermine the foundation of Hillary Clinton’s once formidable electoral college firewall. Key swing states like Florida, Nevada, and North Carolina, which for weeks had shown small but consistent leads for Clinton, suddenly plunged into Trump territory, while once solid leads in New Hampshire, Virginia, and Pennsylvania appeared to melt into the margin of error. As a result, polling aggregation sites from Nate Silver’s widely-followed 538 to Darryl’s less well known but equally pedigreed analyses here on HA showed Trump’s chances of winning surge into the disturbing realm of the remotely possible.

But what if some of the polls that introduced all this late uncertainty weren’t just wrong, they were, well, intentionally wrong?

Ignore for a moment the reasons why, but if your goal was to game the polling aggregation sites you would probably want to wait until the final weeks of the election to release a flood of new polls with absurdly large sample sizes (and absurdly low margins of error) surveying a handful of key swing states while providing little or no prior track record on which to judge your credibility. In other words: Meet the Remington Research poll.

Coming out of virtually nowhere, the Remington Research Group in collaboration with Axiom Strategies suddenly emerged as one of the most prolific pollsters of the fin de cycle électoral, simultaneously surveying eight “battleground” states on October 23, October 30, and again on November 3. This sudden displaying of polling prowess is particularly remarkable given the incredibly large size of its voter sample—and by “incredibly,” I do mean that these numbers are not credible.

For example, Remington’s November 3 poll (surveyed Nov 1-2) includes and analyzes the responses of 19,640 likely voters across eight states, ranging from a robust 1,793-voter sample in Nevada to an inexplicable 3,076-voter sample in Virginia. Compare that to the ten most recent Virginia polls posted to 538:

The 10 most recent Virginia polls.

One of these things is not like the others.

The second largest sample size of the group is SurveyMonkey’s 2,109, and even that’s an outlier given that it’s an online poll that typically uses larger samples in order to compensate for selection bias and other errors. Remington claims to be conducting its surveys via IVR (interactive voice response) technology—good old fashioned robocalling—a method that normally would suffice with about a 1,000-voter sample in a state the size of Virginia. A similar pattern can be seen in survey after survey, state after state, with Remington standing out by far as the largest sample size in any state (and generally one of the most Trump-leaning).

Darryl continues to include Remington in his analysis because it fits his inclusion criteria, and he correctly does not want to change criteria mid-cycle. But those large sample sizes immediately jumped out at Darryl as odd. As Darryl explains, response rates for IVR are notoriously low—probably around 10 percent. That means Remington would have needed to dial about 200,000 voters over two days to achieve its 19,640-voter sample, and then analyze all these results. That may not be beyond the capabilities of a large, established pollster, but it’s not the sort of operation one builds overnight. Further catching Darryl’s eye is Remington’s unusually low reported margin of error: “+/- 1.77” in that Virginia poll, for example. That’s not only weirdly low, it’s weirdly precise; experienced pollsters don’t tend to present that number out to the second decimal place, says Darryl.

Remember: polling is expensive. A typical 600-800-voter IVR survey might cost a campaign or media outlet about $8,000 or more, and a live interviewer telephone survey would cost several times that. (A high-quality live-interview bilingual internal poll of the sort statewide campaigns use might cost $30,000 or more.) So why would Axiom/Remington put in the extra time and money to survey four times as many voters as the typical public state poll?

One obvious answer would be to game the average margins calculated by all these polling aggregators everyone is obsessing on. I’m way oversimplifying it, but the way these polling aggregators generally work is that they add up all the samples from various polls over a specified period of time, and then do some math to them. They essentially create one giant poll out of many in an effort to smooth out the variation and find (as Silver would say it) “the signal in the noise.” (Darryl could explain it better, but in many more words. If you’re curious, you can read his entire simulation FAQ here.)

And what that means is that Remington’s 3,076-voter survey that had Clinton at just +2 influences the average about 4.7 times more than Roanoke College’s 654-voter sample that had Clinton at a robust +7. (Well, not exactly. But again, ask Darryl.) In fact, under most models, Remington’s extremely low reported margin of error would overweight its impact even more.

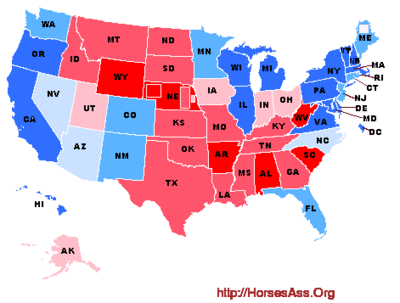
Thus, flood the media with some very-large-sample Trump-leaning polls, and the state of the race in some of these battleground states starts to look very different. For example, as of last night, Darryl had Clinton with only a 27.9 percent probability of winning Florida—but remove the Remington polls and Clinton’s probability jumps to 68.2 percent! In other words, a single pollster can flip Florida. Likewise, Clinton’s probability of winning an Electoral College majority would’ve climbed from 80 percent with Remington to 94 percent without. For many nervous poll-watchers, that’s the difference between wet sheets and dry sheets.

But what’s in it for Remington? Well, to know for sure, you’d have to ask the Remington Group. Or maybe their partner, Axiom Strategies.  Or better yet, Ted Cruz’s former presidential campaign chief strategist Jeff Roe, who happens to own both the Remington Group and Axiom Strategies. But I have three theories:

  1. Bump up turnout in support of down-ballot Republicans. As the Princeton Election Consortium’s Sam Wang recently explained, “increased confidence is associated with increased turnout.” Sure, Trump may be a lost cause, but as long as Trump supporters don’t know it, down-ballot Republicans won’t suffer quite as much.
  2. Undermine public faith in the outcome of this election.  If Hillary Clinton substantially over-performs the polling averages it will look awfully suspicious to voters already primed by Trump’s relentless voter fraud allegations. I mean, Nate Silver has never been wrong before, so why would he miss a few key states this time around? Such suspicions will serve Republicans well as they continue their efforts to delegitimize Clinton through hearings, confirmation battles, and ultimately impeachment.
  3. Fuck with Nate Silver. Silver has been the target of a lot of well-deserved criticism this cycle for all the click-baity volatility he built into his new (and opaque) models—but four years ago he was a goddamn hero for the way he championed data-driven journalism over the usual data-free kind. Republicans hate Silver for interfering with their election narrative. So maybe this is just payback?

Whatever the reason, the fact is that these Remington polls just don’t pass the smell test. (Clinton is winning only 65% of African-Americans in Virginia, and only 48% of Hispanics in Nevada? I don’t think so.) And Remington isn’t the only late-comer to flood the swing state polling swamp with suspiciously pro-Trump results. Republican consultancy shop Trafalgar Group (infamous robocaller and former Chris Christie advisor Robert Cahaly) has generated a wave of weirdly-worded surveys that purport to reveal a “shy Trump-voter” demographic that every other pollster has missed! Trafalgar too calculates its margin of error to the second decimal place, a level of precision that feels out-of-place amidst their outlier results. (Trump is up 2 points in Michigan, or something!)

Yeah, sure, all of the aggregators will ultimately call this election correctly, in that Clinton will win by some margin or another. And at this late stage there’s little if any argument over who is leading where. But I’ve no doubt that Republicans are attempting to game the system in a way that makes this whole poll aggregation endeavor far less useful than it was in the past two presidential cycles. So don’t be surprised on Tuesday night if the presidential election turns out to be less competitive than we’ve all been led to believe.

8 Stoopid Comments

Poll Analysis: Clinton slips a little more

by Darryl — Sunday, 11/6/16, 5:21 pm

Clinton
Trump
86.8% probability of winning
13.2% probability of winning
Mean of 290 electoral votes
Mean of 248 electoral votes


Electoral College Map

Alabama Alaska Arizona Arkansas California Colorado Connecticut Delaware Florida Georgia Hawaii Idaho Illinois Indiana Iowa Kansas Kentucky Lousiana Maine Maryland Massachusettes Michigan Minnesota Mississippi Missouri Montana Nebraska Nevada New Hampshire New Jersey New Mexico New York North Carolina North Dakota Ohio Oklahoma Oregon Pennsylvania Rhode Island South Carolina South Dakota Tennessee Texas Utah Vermont Virginia D.C. Washington West Virginia Wisconsin Wyoming

Electoral College Map

Georgia Alaska Arizona Arkansas California Colorado Delaware Connecticut Florida Mississippi Alabama Hawaii Idaho Illinois Indiana Iowa Kansas Kentucky Louisiana Maine Maryland Massachusetts Michigan Minnesota Missouri Montana Nebraska Nevada New Hampshire New Jersey New Mexico New York North Carolina North Dakota Ohio Oklahoma Oregon Pennsylvania Rhode Island South Carolina South Dakota Tennessee Texas Utah Vermont Virginia D.C. Washington West Virginia Wisconsin Wyoming

On Friday, my analysis showed Sec. Hillary Clinton leading Donald Trump with a mean of 295 to 243 electoral votes. If the election had been held on Friday, Clinton would have won with a 94.2% probability.

There were only a few new polls released on Saturday. On Sunday a few more were released and I found a few missing from the database. We now have eleven new polls added since the last analysis. Of course, some polls will “age-out” on account of being more than ten days old.

Today, after 100,000 simulated elections, Clinton wins 86,835 times and Trump wins 13,165 times (including the 2,645 ties). Clinton received (on average) 290 (-5) to Trump’s 248 (+5) electoral votes. In an election held now, Clinton would have a 86.8% probability of winning and Trump would have a 13.2% probability of winning.

The biggest changes occur in ten states + Maine’s two Congressional districts. Five of these changes favor Clinton and six favor Trump.

  • Florida (+Clinton): No new polls in Florida, but five polls slightly favoring Trump “age out”. This shifts Clinton’s chances from 43% to 53%. Florida is still a toss-up, but now Clinton has a tiny edge.
    clintontrump06oct16-06nov16florida
  • Georgia (+Clinton): We lost one and gained one poll. The four current polls are slightly better for Clinton. Trump drops from a 96% chance to a 91% chance of taking the state.
    clintontrump06oct16-06nov16georgia
  • Iowa (+Trump): Two new polls, including one Trump+7% poll shifts Trump’s chances from 70% to 89%.
    clintontrump06oct16-06nov16iowa
  • Maine (+Trump): No new polling, but one poll ages out. In the state overall, Clinton drops from 90% to 79% chance of winning the state.
  • Maine CD-1 (+Trump): Maine’s CD-1 has changed as well. Clinton drops from 98% to 82% chance.
  • Maine CD-2 (+Clinton): The dropped poll favored Trump. Now we have one poll that favors Clinton. Her chances have gone from 44% to 62%, flipping ME-2 from red to blue.
  • Nevada (+Trump): We lose a poll and gain a poll since Friday for a total of four current polls. The new poll, from the Trafalgar Group, is a Republican pollser. Remington Research, another Republican pollster, contributes as well. The net result is that Trump has gone from 86% to 96% chances in the state. Yes…I’ve read about the early voting, and even read the piece about how Harry Reid has put Nevada out of reach for Trump. Still, my analyses are driven by polls.
    clintontrump06oct16-06nov16nevada
  • New Hampshire (+Trump): One poll has aged out. It is Clinton+3%, so Trump goes from a 51% chance on Friday to a 58% chance today.
    clintontrump06oct16-06nov16new-hampshire
  • New Mexico (+Clinton): We had a Clinton+3% poll on Friday, and the addition of a second poll, with Clinton at +5%, so Clinton goes from chances of 77% to 86%.
    clintontrump06oct16-06nov16new-mexico
  • North Carolina (+Trump): Four polls drop out, and three favored Clinton, plus a tie. Here is another case where we have a pair of polls from Remington Research and The Grafalgar Group, both G.O.P. pollsters. The result is Trump moves from a 46% probability to a 91% probability of taking North Carolina.
    clintontrump06oct16-06nov16north-carolina
  • Ohio (+Clinton): We lose two old polls (a tie and a Trump+4.4% from Trafalgar Group) and gain one new poll (Clinton+1% from a mail-in Columbus Dispatch poll). The result is that Trump’s chances have dropped from 96% to 86%.
    clintontrump06oct16-06nov16ohio

The long term trends in this race can be seen from a series of elections simulated every seven days using polls from 06 Nov 2015 to 06 Nov 2016, and including polls from the preceding ten days (FAQ).

An animated sequence of maps and electoral vote distributions can be seen here

Here is the distribution of electoral votes [FAQ] from the simulations:

The distribution takes on an interesting bimodal (or even trimodal) form. The major modes at 301 and 272 are caused by the fact that Florida is nearly a toss-up (272 + Florida’s 29 EVs = 301). If tonight was election night, an early call in Florida would tell us whether Clinton walks away with the election or whether it is going to be a long night!

The small variability around the two major modes is largely driven by the fact that New Hampshire is almost a toss-up.

That third mode to the right is largely driven by Ohio, which isn’t quit a toss-up at an 86% chance of going to Trump.

[Read more…]

2 Stoopid Comments

Poll Analysis: Control of the Senate shifts to the GOP

by Darryl — Saturday, 11/5/16, 6:54 pm


Senate Democrats*
Senate Republicans
12.1% probability
87.9% probability
Mean of 49 seats
Mean of 51 seats

Electoral College Map

Alabama Alaska Arizona Arkansas California Colorado Connecticut Delaware Florida Georgia Hawaii Idaho Illinois Indiana Iowa Kansas Kentucky Lousiana Maine Maryland Massachusettes Michigan Minnesota Mississippi Missouri Montana Nebraska Nevada New Hampshire New Jersey New Mexico New York North Carolina North Dakota Ohio Oklahoma Oregon Pennsylvania Rhode Island South Carolina South Dakota Tennessee Texas Utah Vermont Virginia D.C. Washington West Virginia Wisconsin Wyoming

My analysis last Sunday showed control of the Senate to be a toss up at 48% probability for Democrats and 52% for Republicans. The expected outcome was a 49 to 51 split in favor of the Republicans.

Since then, I’ve added something exceeding 50 polls to the mix. As we saw in the Presidential race, the polls since last Sunday have tended to be more favoriable to Republicans.

Today, after 100,000 simulated elections, Democrats have a Senate majority 1,762 times, and I’ll assume they control the Senate with the 10,293 ties. The Republicans control the Senate 87,945 times. This suggests Democrats have a 12.1% probability of controlling the Senate and Republicans have a 87.9% probability of controlling the Senate. So, indeed, the Democrat’s chances have fallen.

The Republican candidate has primarily gained in five states.

In Indiana, Democrat Evan Bayh’s once solid lead has vanished. Last Sunday, he had an 88.5% probability of defeating Todd Young (R). Today he would win with a 24.1% probability. The polling picture pretty much tells the story.

senate05oct16-05nov16indiana1

Sen. Roy Blunt (R) has strengthened his lead over Jason Kander (D) in Missouri. Last analysis Blunt was at a 77.8% probability of winning, but five new polls, including two ties and three with Blunt up, puts the probability at 92.8% today. On the other hand, two months ago, there was little evidence that Blunt would lose.

senate05oct16-05nov16missouri2

In Nevada, five polls aged out, and these mostly favored Catherine Cortez Mastro (D) over Joe Heck (R). Heck leads in four of the five current polls. Consequently, the Republican has gone from a 54% to a 93% probability of winning today.

senate05oct16-05nov16nevada1

The story is somewhat similar in New Hampshire. Four polls aged out, including one that had Maggie Hassan (D) up by +9 over Sen. Kelly Ayotte (R). The new polling has mostly been more favorable to Ayotte. We now have ten current polls, six that favor Ayotte, two that favor Hassan, and two ties. The net result is that Ayotte has gone from a 67% chance to an 86% chance of winning an election today.

senate05oct16-05nov16new_hampshire2

In Wisconsin, four polls aged out, including one with Russ Feingold leading Sen. Ron Johnson by +12%. The four current polls have Feingold up by +8%, +5%, +1%, and +2%. As a result, Feingold’s chances have dropped from 99.8% to 85.9%.

senate05oct16-05nov16wisconsin1

Democrats have made a couple of notable gains.

The North Carolina senate race largely favors Sen. Richard Burr (R) over challenger Deborah Ross (D). But the last couple of days have seen one tie and two polls that favor the Democrat. The result is that Burr has fallen from a 90% probability of winning last Sunday to an 86% chance today.

senate05oct16-05nov16north_carolina1

The biggest news for Democrats happens in Pennsylvania, where Sen. Pat Toomey (R) is being challenged by Democrat Katie McGinty. Seven polls aged-out, and these polls were pretty much a toss-up between the two candidates. Eight new polls have been added that largely favor McGinty. With the four carry-over polls, we now have two current polls that favor Toomey, eight that favor McGinty, and two ties. As a result, Pennsylvania has flipped from red to blue. McGinty was at a 45.8% probability of winning last Sunday, and she would win a race today with a 99.7% probability.

senate05oct16-05nov16pennsylvania2

Here is the distribution of Senate seats from the simulations:*

This graphs shows the probability of at least each number of seats controlled by the Democrats:*

  • 100000 simulations: Democrats control the Senate 12.1%, Republicans control the Senate 87.9%.
  • Average ( SE) seats for Democrats: 48.5 ( 0.8)
  • Average (SE) seats for Republicans: 51.5 ( 0.8)
  • Median (95% CI) seats for Democrats: 48 (47, 50)
  • Median (95% CI) seats for Republicans: 52 (50, 53)

Expected outcomes from the simulations:

  • Democratic seats w/no election: 35
  • Independent seats w/no election: one
  • Republican seats w/no election: 30
  • Contested Democratic seats likely to remain Democratic: nine
  • Contested Republican seats likely to remain Republican: 21
  • Contested Democratic seats likely to switch: one
  • Contested Republican seats likely to switch: three

This table shows the number of Senate seats controlled for different criteria for the probability of winning a state:* Safe>0.9999, Strong>90%, Leans>60%, Weak>50%

Threshold Safe + Strong + Leans + Weak
Safe Democrat 45
Strong Democrat 2 47
Leans Democrat 1 1 48
Weak Democrat 0 0 0 48
Weak Republican 0 0 0 52
Leans Republican 3 3 52
Strong Republican 4 49
Safe Republican 45

This table summarizes the results by state. Click on the poll number to see the individual polls included for a state.

# Sample Percent Percent Democrat Republican
State @ polls size Democrat Republican % wins % wins
AL 0 0 (0) (100)
AK 1& 320 23.4 76.6 0.0 100.0
AZ 6 3957 43.6 56.4 0.0 100.0
AR 2 1006 38.7 61.3 0.0 100.0
CA 3 2372 62.0 38.0 100.0 0.0
CO 3 1681 54.3 45.7 99.2 0.8
CT 1& 872 61.7 38.3 100.0 0.0
FL 13 9570 47.4 52.6 0.0 100.0
GA 6 3788 43.4 56.6 0.0 100.0
HI 0 0 (100) (0)
ID 1 823 29.5 70.5 0.0 100.0
IL 3 1973 56.8 43.2 100.0 0.0
IN 2 884 48.3 51.7 24.1 75.9
IA 4 2548 38.1 61.9 0.0 100.0
KS 1 535 36.4 63.6 0.0 100.0
KY 2 1323 43.4 56.6 0.1 99.9
LA 1& 794 34.6 65.4 0.0 100.0
MD 1& 614 66.6 33.4 100.0 0.0
MO 7 5594 48.6 51.4 7.2 92.8
NV 5 3356 48.2 51.8 6.6 93.4
NH 10 6238 49.1 50.9 14.4 85.6
NY 1 568 71.0 29.0 100.0 0.0
NC 11 7216 49.1 50.9 15.3 84.7
ND 0 0 (0) (100)
OH 3 1609 40.9 59.1 0.0 100.0
OK 0 0 (0) (100)
OR 1& 558 62.7 37.3 100.0 0.0
PA 12 9083 51.9 48.1 99.7 0.3
SC 1& 941 38.4 61.6 0.0 100.0
SD 3 2031 36.7 63.3 0.0 100.0
UT 3 1394 29.5 70.5 0.0 100.0
VT 1 559 69.1 30.9 100.0 0.0
WA 2 1103 59.4 40.6 100.0 0.0
WI 4 2465 51.6 48.4 85.9 14.1

@ Current party in office
& An older poll was used (i.e. no recent polls exist).
*Analysis assume that the two independent candidates will caucus with the Democrats.

Details of the methods are given in the FAQ.

Follow me (@hominidviews) on Twitter for Senate and Presidential polling and analysis updates.

3 Stoopid Comments

Poll Analysis: Hillary’s slide stops

by Darryl — Friday, 11/4/16, 7:08 pm

Clinton
Trump
94.2% probability of winning
5.8% probability of winning
Mean of 295 electoral votes
Mean of 243 electoral votes


Electoral College Map

Alabama Alaska Arizona Arkansas California Colorado Connecticut Delaware Florida Georgia Hawaii Idaho Illinois Indiana Iowa Kansas Kentucky Lousiana Maine Maryland Massachusettes Michigan Minnesota Mississippi Missouri Montana Nebraska Nevada New Hampshire New Jersey New Mexico New York North Carolina North Dakota Ohio Oklahoma Oregon Pennsylvania Rhode Island South Carolina South Dakota Tennessee Texas Utah Vermont Virginia D.C. Washington West Virginia Wisconsin Wyoming

Electoral College Map

Georgia Alaska Arizona Arkansas California Colorado Delaware Connecticut Florida Mississippi Alabama Hawaii Idaho Illinois Indiana Iowa Kansas Kentucky Louisiana Maine Maryland Massachusetts Michigan Minnesota Missouri Montana Nebraska Nevada New Hampshire New Jersey New Mexico New York North Carolina North Dakota Ohio Oklahoma Oregon Pennsylvania Rhode Island South Carolina South Dakota Tennessee Texas Utah Vermont Virginia D.C. Washington West Virginia Wisconsin Wyoming

Yesterday the analysis had Sec. Hillary Clinton leading Donald Trump with, on average, 296 electoral votes to 242. And Clinton’s probablity of winning was 93.9% to Trump’s 6.1% chance.

Today there were 19 new polls released. To me, the one noticable thing about today’s batch is that they weren’t that bad for Clinton and not that bad for Trump. You can see the polls and my comments on my Twitter timeline (@hominidviews).

My impression was verified by today’s analysis. After 100,000 simulated elections, Clinton wins 94,164 times and Trump wins 5,836 times (including the 950 ties). Clinton received (on average) 295 to Trump’s 243 electoral votes. In an election held now, Clinton would have a 94.2% probability of winning and Trump would have a 5.8% probability of winning.

In other words, very little has changed from today’s poll dump. This suggests that Hillary’s slide we’ve seen for the past week has hit bottom. If so, she may even make gains in the final four days, as Obama did in 2012.

The long term trends in this race can be seen from a series of elections simulated every seven days using polls from 04 Nov 2015 to 04 Nov 2016, and including polls from the preceding ten days (FAQ).

An animated sequence of maps and electoral vote distributions can be seen here

Here is the distribution of electoral votes [FAQ] from the simulations:
[Read more…]

4 Stoopid Comments

Poll Analysis: More gains for Trump

by Darryl — Thursday, 11/3/16, 10:17 pm

Clinton
Trump
93.9% probability of winning
6.1% probability of winning
Mean of 296 electoral votes
Mean of 242 electoral votes


Electoral College Map

Alabama Alaska Arizona Arkansas California Colorado Connecticut Delaware Florida Georgia Hawaii Idaho Illinois Indiana Iowa Kansas Kentucky Lousiana Maine Maryland Massachusettes Michigan Minnesota Mississippi Missouri Montana Nebraska Nevada New Hampshire New Jersey New Mexico New York North Carolina North Dakota Ohio Oklahoma Oregon Pennsylvania Rhode Island South Carolina South Dakota Tennessee Texas Utah Vermont Virginia D.C. Washington West Virginia Wisconsin Wyoming

Electoral College Map

Georgia Alaska Arizona Arkansas California Colorado Delaware Connecticut Florida Mississippi Alabama Hawaii Idaho Illinois Indiana Iowa Kansas Kentucky Louisiana Maine Maryland Massachusetts Michigan Minnesota Missouri Montana Nebraska Nevada New Hampshire New Jersey New Mexico New York North Carolina North Dakota Ohio Oklahoma Oregon Pennsylvania Rhode Island South Carolina South Dakota Tennessee Texas Utah Vermont Virginia D.C. Washington West Virginia Wisconsin Wyoming

Yesterday’s analysis showed Donald Trump gaining a little over Sec. Hillary Clinton. She had a 99.7% probability of winning an election, and a mean electoral vote of 315.

Since yesterday’s analysis there have been 22 new polls released. The polls feel like they are a little more favorable to Trump. Indeed, now after 100,000 simulated elections, Clinton wins 93,944 times and Trump wins 6,056 times (including the 1,017 ties). Clinton received (on average) 296 to Trump’s 242 electoral votes. In an election held now, Clinton would have a 93.9% probability of winning and Trump would have a 6.1% probability of winning.

I should point out that there is one big change from yesterday. I am now using a 10-day poll window instead of a 14-day window. Doing this tends to nudge each candidate toward 50% probability of winning because sample sizes drop in each state. Additionally, the polls that are dropped are all pre-Comey polls. Clinton has slipped in the last two weeks, so we would expect a 10 day window to be worse for her than a 14 day window. The opposite happens when she is on an up-swing (see the time trend graph below to see both phenomena).

Something else of interest: four years ago tomorrow (Friday), I did an analysis that had Pres. Barack Obama up on Gov. Mitt Romney, 94.4% to 5.6% with a mean electoral vote total of 302 to 236. Essentially, Clinton is running at about the same strength now as Obama was in 2012. One difference, perhaps, is that Obama was starting to gain at this point, whereas Clinton seems to be losing EVs.

There are a few noteworthy shifts from my previous analysis.

Arizona loses two blue polls and a tie. Now all the current polls have small margins for Trump. His chances have gone up from 77% to 97%.

clintontrump03oct16-03nov16arizona

In Colorado, Trump doesn’t lead in any of the current polls. But the small margins for Clinton means that Trump moves from 5% to 21% chances of taking the state.

Florida switches from blue to red, primarily on account of (1) a bunch of pro-Clinton polls being dropped and (2) the addition of a Trump+4 Remington poll. Almost every Remington state presidentail poll I’ve seen this year looks like it is about 3 points skewed toward the Republican. And the firm is a Republican pollster. Still, it seems to be a real, valid pollster. In any case, we went from Clinton at 68% probability of winning to Trump at 58% in Florida.

clintontrump03oct16-03nov16florida

Clinton slips a little bit in Maine, but this is entirely due to a smaller sample size from dropping one of three current polls.

The same thing happens in Maine’s 2nd CD, but now we are left with a pro-Trump and a pro-Clinton poll. Trump’s chances have increased from 44% to 57%. Earlier in the election season, Trump had a solid lead in ME-2.

clintontrump03oct16-03nov16maine-2

In Nevada, we lost 6 polls, all but one favoring Clinton, and added one new pro-Clinton poll. This gives us four current polls: Clinton+2, Trump+6, Trump+6 and a tie. The Trump+4 poll is from Remington, by the way. This changes Clinton’s chances from 56% yeterday to only 13% today.

clintontrump03oct16-03nov16nevada

Over the last month, New Hampshire has seen a shift from strong Clinton to about even. Right now, Clinton would be expected to win NH with a 61% probability.

clintontrump03oct16-03nov16new-hampshire

We have lots of new North Carolina polling. While most of the current polls favor Clinton, 3 of the 4 most recent ones favor Trump. One of them is, you guessed it, Remington. In any case, Clinton drops from 80% chance to 53% chance. A toss-up if there ever was one.

clintontrump03oct16-03nov16north-carolina

The long term trends in this race can be seen from a series of elections simulated every seven days using polls from 03-Nov-2015 to 03-Nov-2016, and including polls from the preceding ten days (FAQ).

An animated sequence of maps and electoral vote distributions can be seen here

Here is the distribution of electoral votes [FAQ] from the simulations:
[Read more…]

1 Stoopid Comment

Poll Analysis: Clinton has big lead but Trump gains

by Darryl — Wednesday, 11/2/16, 4:40 pm

Clinton
Trump
99.7% probability of winning
0.3% probability of winning
Mean of 315 electoral votes
Mean of 223 electoral votes


Electoral College Map

Alabama Alaska Arizona Arkansas California Colorado Connecticut Delaware Florida Georgia Hawaii Idaho Illinois Indiana Iowa Kansas Kentucky Lousiana Maine Maryland Massachusettes Michigan Minnesota Mississippi Missouri Montana Nebraska Nevada New Hampshire New Jersey New Mexico New York North Carolina North Dakota Ohio Oklahoma Oregon Pennsylvania Rhode Island South Carolina South Dakota Tennessee Texas Utah Vermont Virginia D.C. Washington West Virginia Wisconsin Wyoming

Electoral College Map

Georgia Alaska Arizona Arkansas California Colorado Delaware Connecticut Florida Mississippi Alabama Hawaii Idaho Illinois Indiana Iowa Kansas Kentucky Louisiana Maine Maryland Massachusetts Michigan Minnesota Missouri Montana Nebraska Nevada New Hampshire New Jersey New Mexico New York North Carolina North Dakota Ohio Oklahoma Oregon Pennsylvania Rhode Island South Carolina South Dakota Tennessee Texas Utah Vermont Virginia D.C. Washington West Virginia Wisconsin Wyoming

The previous analysis last Thursday showed Sec. Hillary Clinton winning the election with near certainty with, on average, 333 electoral votes (EVs) to Donald Trump’s 205 EVs.

Since then, there have been 91 new new polls released that satisfy my inclusion criteria. So today, after 100,000 simulated elections, Clinton wins 99,714 times and Trump wins 286 times (including the 9 ties). Clinton received (on average) 315 (-18) to Trump’s 223 (+18) electoral votes.

In an election held now, Clinton would have a 99.7% (-0.3%) probability of winning and Trump would have a 0.3% probability of winning.

There are a few interesting changes since Thursday. Most notably, Alaska is suddently blue! The only current poll has Clinton up by +4%. Previous polls had Trump leading. The trend towards Clinton looks plausible:

clintontrump02oct16-02nov16alaska

New polls have turned Arizona back to red again after being blue for some days. Last Thursday, Clinton would have won AZ with a 75% probability. Today, Trump would win with a 77% probability. The trend toward Trump is convincing:

clintontrump02oct16-02nov16arizona

Florida had been leaning blue last Thursday. A bunch of new polls has painted a redder picture, although Clinton’s chances have only dropped from 84% to 68%. Here is the last week of polling:

clintontrump02oct16-02nov16florida

In Indiana, a new Trump+11 poll has strengthened Trump’s chances from 89% to 98%.

Last week we had two Iowa polls that, together, favored Trump. Now, the only current poll is a tie between the candidates dropping Trump’s chances from 71% to 50%.

clintontrump02oct16-02nov16iowa

Some new Maine polls have changed little beyond the state’s 2nd congressional district. Trump had a weak lead last week and now Clinton leads in two of the three current polls. Trump had a 58% chance of taking the CD last week; now Clinton has a 57% chance of taking it.

clintontrump02oct16-02nov16maine-2

In Minnesota, a new poll gives Clinton a +10 margin, increasing her chances of taking the state to 99%.

In rare gains for Clinton, a new Montana poll only has Trump up by +1% instead of double digits. This lowers Trump’s chances from 100% to 97.7%.

We have three new polls in Nevada, and two of them give Trump a slight lead. The result is that Clinton’s chances have dropped from 83% to 56%. The state is, essentially, tied now.

clintontrump02oct16-02nov16nevada

Since last week, eight new North Carolina polls have come and a few lost out for a total of 14 current polls. What do all they new polls reveal? Clinton still has an 80% chance of taking the state. Here is the last two months of polling:

clintontrump02oct16-02nov16north-carolina

Ohio has gone more strongly for Trump. Last Thursday, Trump had an 89% chance of taking the state. Today that is 98%.

clintontrump02oct16-02nov16ohio

Oregon went from three current polls to one new one with Clinton at +7%. Because the poll is small there is great uncertainty, and Clinton’s chances have dropped to about 90%.

Pennsylvania has had a big polling rush the last few days. It hasn’t made much difference. Clinton wins every one, even if by small margins.

clintontrump02oct16-02nov16pennsylvania

Last week, Trump was badly slipping in Texas, with +3% and +4% polls. Now, we have two new polls with Trump at +7% and +12%. Consequently Clinton’s chances have dropped in Texas from 14% to 0.1%.

Something similar has happened in Utah—polls tanked for Trump last week. This week they rebound with Trump up last week from 87% to about 100%.

The long term trends in this race can be seen from a series of elections simulated every seven days using polls from 02 Nov 2015 to 02 Nov 2016, and including polls from the preceding 21 days (FAQ).

An animated sequence of maps and electoral vote distributions can be seen here

Here is the distribution of electoral votes [FAQ] from the simulations:
[Read more…]

27 Stoopid Comments

Poll Analysis: The Senate is a toss-up

by Darryl — Sunday, 10/30/16, 2:04 pm


Senate Democrats*
Senate Republicans
48.0% probability
52.0% probability
Mean of 49 seats
Mean of 51 seats

Electoral College Map

Alabama Alaska Arizona Arkansas California Colorado Connecticut Delaware Florida Georgia Hawaii Idaho Illinois Indiana Iowa Kansas Kentucky Lousiana Maine Maryland Massachusettes Michigan Minnesota Mississippi Missouri Montana Nebraska Nevada New Hampshire New Jersey New Mexico New York North Carolina North Dakota Ohio Oklahoma Oregon Pennsylvania Rhode Island South Carolina South Dakota Tennessee Texas Utah Vermont Virginia D.C. Washington West Virginia Wisconsin Wyoming

My analysis last Tuesday showed control of the Senate going to the Democrats with a 63.5% probability and 50 seats. I’ve added a bunch of new Senate polls since then, and things look tied up.

Today, after 100,000 simulated elections, Democrats have a Senate majority 15,370 times and there were 32,633 ties (which I presume would go to the Democrats), and Republicans control the Senate 51,997 times. So, in an election held today, Democrats would have a 48% probability of controlling the Senate and Republicans would have a 52% probability of controlling the Senate.

Essentially, the Senate is a toss-up. Here are the most important changes since Tuesday.

In the Democrats’ favor, Indiana has gained some clarity from a couple of new polls that favor Democrat Evan Bayh over Republican Todd Young. Bayh’s chances have gone from 56% to 89%.

senate30sep16-30oct16indiana1

Three new polls in Missouri move the race in favor of Republican Sen. Roy Blunt over Democrat Jason Kander. Blunt has gone from a a 35% chance last Tuesday to a 78% chance of taking the seat today.

senate30sep16-30oct16missouri2

In Nevada, we have a battle between Democrat Catherine Cortez Masto and Republican Joe Heck for Sen. Harry Reid’s (D) old seat. We have seven new polls and a couple of continuing polls since Tuesday, when Heck led in every poll. Today, Heck leads in 5 and Masto leads in 4 polls. Consequently, Heck’s chances have declined from 96% to 54%…pretty much a toss-up.

senate30sep16-30oct16nevada1

Today, we have eight new North Carolina polls and four carry-overs from last Tuesday, when the polls pretty evenly split between Democrat Deborah Ross and Republican Sen. Richard Burr. But the new polls have almost entirely gone against the Ross, and her chances have declined from 69% on Tuesday to 10% today.

senate30sep16-30oct16north_carolina1

In Pennsylvania, we have five new polls and five carry-over polls. The new polls have been a bit less favorable to Democrat Katie McGinty. Her chances against Republican Sen. Pat Toomey have declined a bit from 69% to 46%–basically the state is a toss-up.

senate30sep16-30oct16pennsylvania2

Here is the distribution of Senate seats from the simulations:*

This graphs shows the probability of at least each number of seats controlled by the Democrats:*

  • 100000 simulations: Democrats control the Senate 48.0%, Republicans control the Senate 52.0%.
  • Average ( SE) seats for Democrats: 49.5 (1.0)
  • Average (SE) seats for Republicans: 50.5 (1.0)
  • Median (95% CI) seats for Democrats: 49 (48, 52)
  • Median (95% CI) seats for Republicans: 51 (48, 52)

Expected outcomes from the simulations:

  • Democratic seats w/no election: 35
  • Independent seats w/no election: one
  • Republican seats w/no election: 30
  • Contested Democratic seats likely to remain Democratic: nine
  • Contested Republican seats likely to remain Republican: 21
  • Contested Democratic seats likely to switch: one
  • Contested Republican seats likely to switch: three

This table shows the number of Senate seats controlled for different criteria for the probability of winning a state:* Safe>0.9999, Strong>90%, Leans>60%, Weak>50%

Threshold Safe + Strong + Leans + Weak
Safe Democrat 46
Strong Democrat 1 47
Leans Democrat 1 1 48
Weak Democrat 0 0 0 48
Weak Republican 2 2 2 52
Leans Republican 3 3 50
Strong Republican 4 47
Safe Republican 43

This table summarizes the results by state. Click on the poll number to see the individual polls included for a state.

# Sample % % Dem Rep
State @ polls size Dem Rep % wins % wins
AL 0 0 (0) (100)
AK 1 320 23.4 76.6 0.0 100.0
AZ 3 1425 42.9 57.1 0.0 100.0
AR 1 398 39.4 60.6 0.2 99.9
CA 2 1137 66.3 33.7 100.0 0.0
CO 4 2463 57.5 42.5 100.0 0.0
CT 1& 872 61.7 38.3 100.0 0.0
FL 13 8100 47.4 52.6 0.0 100.0
GA 4 3001 42.4 57.6 0.0 100.0
HI 0 0 (100) (0)
ID 2 1309 30.2 69.8 0.0 100.0
IL 2 1780 57.1 42.9 100.0 0.0
IN 3 1361 52.3 47.7 88.5 11.5
IA 1 744 40.5 59.5 0.0 100.0
KS 1 506 36.2 63.8 0.0 100.0
KY 1& 440 43.2 56.8 1.9 98.1
LA 1& 794 34.6 65.4 0.0 100.0
MD 1& 614 66.6 33.4 100.0 0.0
MO 3 1450 48.6 51.4 22.2 77.8
NV 9 6135 49.9 50.1 46.4 53.6
NH 9 5573 49.6 50.4 32.6 67.4
NY 1 568 71.0 29.0 100.0 0.0
NC 14 8208 49.0 51.0 10.0 90.0
ND 0 0 (0) (100)
OH 9 5050 41.5 58.5 0.0 100.0
OK 0 0 (0) (100)
OR 2 1619 61.7 38.3 100.0 0.0
PA 11 6155 49.9 50.1 45.8 54.2
SC 1& 941 38.4 61.6 0.0 100.0
SD 0 0 (0) (100)
UT 2 983 31.8 68.2 0.0 100.0
VT 2 1085 70.9 29.1 100.0 0.0
WA 1 462 63.0 37.0 100.0 0.0
WI 6 3659 53.5 46.5 99.8 0.2

@ Current party in office
& An older poll was used (i.e. no recent polls exist).
*Analysis assume that the two independent candidates will caucus with the Democrats.

Details of the methods are given in the FAQ.

Follow @hominidviews on Twitter for Senate and Presidential polling and analysis updates.

9 Stoopid Comments

Poll Analysis: Clinton leads, but small gains for Trump

by Darryl — Thursday, 10/27/16, 12:03 pm

Clinton
Trump
> 99.9% probability of winning
< 0.01% probability of winning
Mean of 333 electoral votes
Mean of 205 electoral votes


Electoral College Map

Alabama Alaska Arizona Arkansas California Colorado Connecticut Delaware Florida Georgia Hawaii Idaho Illinois Indiana Iowa Kansas Kentucky Lousiana Maine Maryland Massachusettes Michigan Minnesota Mississippi Missouri Montana Nebraska Nevada New Hampshire New Jersey New Mexico New York North Carolina North Dakota Ohio Oklahoma Oregon Pennsylvania Rhode Island South Carolina South Dakota Tennessee Texas Utah Vermont Virginia D.C. Washington West Virginia Wisconsin Wyoming

Electoral College Map

Georgia Alaska Arizona Arkansas California Colorado Delaware Connecticut Florida Mississippi Alabama Hawaii Idaho Illinois Indiana Iowa Kansas Kentucky Louisiana Maine Maryland Massachusetts Michigan Minnesota Missouri Montana Nebraska Nevada New Hampshire New Jersey New Mexico New York North Carolina North Dakota Ohio Oklahoma Oregon Pennsylvania Rhode Island South Carolina South Dakota Tennessee Texas Utah Vermont Virginia D.C. Washington West Virginia Wisconsin Wyoming

About 40 new polls have been released since my previous analysis a week ago. Sec. Hillary Clinton was winning with near certainty and up 338 electoral votes to Donald Trump’s 200 electoral votes.

Today, after 100,000 simulated elections, Clinton wins 99,925 times and Trump wins 75 times. Clinton received (on average) 333 to Trump’s 205 electoral votes. In an election held now, Clinton would have a greater than 99.9% probability of winning and Trump would have a less than 0.01% probability of winning.

A few states have shown some interesting changes since last week.

  • Arizona: Trump’s long non-winning streak is broken with a new Trump+1% poll that reduces Clinton’s chances of winning the state from 79% to 74%.

    clintontrump27sep16-27oct16arizona

  • Florida: Most recent polls have had Clinton up by a small margin, but this week we get a large Remington poll that has the state tied and a Bloomberg poll that has Trump up +2%. As a result, Clinton drops from a 93% chance of winning the state last week to an 85% chance of winning the state this week.

    clintontrump27sep16-27oct16florida

  • Iowa: Trump has led in most polls, but one recent poll has Clinton up by +0.6%. Trump’s chances have dropped from 79% to 71%.

    clintontrump27sep16-27oct16iowa

  • Louisiana: Two new polls have Trump up by double digits, moving him from 94% to 100% chance of winning the state.
  • North Carolina: Clinton has led in all recent polls, until a large Remington poll put Trump up by +3%. Clinton’s chances driop from 88% to 80%.

    clintontrump27sep16-27oct16north-carolina

  • Ohio: The most recent polls have Trump up by small margins. This has shifted Ohio from a 65% probabilitiy of a Trump win to a 89% probability.

    clintontrump27sep16-27oct16ohio

  • South Dakota: Last week we only had an old poll that had Trump up by double digits, giving Trump a certain win. A new Maxon-Dixon poll has Trump up by +7%, but the small size of the poll means that Trump’s chances are pegged at 89% new.
  • Texas: We have only 2 current polls and Trump has tiny margins (+3% and +4%). Trump’s chances have dropped from 96% to 86% as a result.

The long term trends in this race can be seen from a series of elections simulated every seven days using polls from 27 Oct 2015 to 27 Oct 2016, and including polls from the preceding 21 days (FAQ).

An animated sequence of maps and electoral vote distributions can be seen here

Here is the distribution of electoral votes [FAQ] from the simulations:
[Read more…]

No Comments

Poll Analysis: The Washington Gubernatorial Race

by Darryl — Monday, 10/24/16, 10:34 pm

I’ve largely neglected local and statewide races this election season. No particular reason, although I haven’t felt that the Republican candidates in the Senate and Gubernatorial races have run particularly strong campaigns.

I guess it isn’t too late though. And today’s Elway poll piqued my interest in the Gubernatorial race. The race matches up Gov. Jay Inslee (D) against challenger Bill Bryant (R).

The poll, conducted from 20 Oct. to 22 Oct on 502 likely voters has a margin of error of 4.5%. Of the 502 respondents, 452 are either for Inslee or Bryant. Inslee received 256 “votes” (51.0%) and Bryant received 196 “votes” (39.0%), with Other or Undecided at 50 “votes” (10.0%). When we normalize the results to just Inslee and Bryant “votes,” Inslee gets 56.6% and Bryant gets 43.4%

I did a Monte Carlo simulation of 1,000,000 simulated elections. The final tally gave Inslee 975,893 wins and Bryant 22,276 wins. In other words, if an election was held now, we would expect Inslee to win with a 97.8% probability, and Bryant with a 2.2% probability.

The probability distribution of electoral vote outcomes pretty much tells the story:

octelway

The previous poll, by Strategies 360 taken from 29 Sep to 3 Oct, gave similar results. The poll surveyed 500 individuals (4.4% MOE) and found Inslee at 50% to Bryant’s 40%, with 10% undecided.

With two weeks to go and ballots already being returned, it seems like Inslee is quite likely to serve a second term.

No Comments

Poll Analysis: The race stabilizes

by Darryl — Thursday, 10/20/16, 5:38 pm

Clinton
Trump
> 99.9% probability of winning
< 0.01% probability of winning
Mean of 338 electoral votes
Mean of 200 electoral votes


Electoral College Map

Alabama Alaska Arizona Arkansas California Colorado Connecticut Delaware Florida Georgia Hawaii Idaho Illinois Indiana Iowa Kansas Kentucky Lousiana Maine Maryland Massachusettes Michigan Minnesota Mississippi Missouri Montana Nebraska Nevada New Hampshire New Jersey New Mexico New York North Carolina North Dakota Ohio Oklahoma Oregon Pennsylvania Rhode Island South Carolina South Dakota Tennessee Texas Utah Vermont Virginia D.C. Washington West Virginia Wisconsin Wyoming

Electoral College Map

Georgia Alaska Arizona Arkansas California Colorado Delaware Connecticut Florida Mississippi Alabama Hawaii Idaho Illinois Indiana Iowa Kansas Kentucky Louisiana Maine Maryland Massachusetts Michigan Minnesota Missouri Montana Nebraska Nevada New Hampshire New Jersey New Mexico New York North Carolina North Dakota Ohio Oklahoma Oregon Pennsylvania Rhode Island South Carolina South Dakota Tennessee Texas Utah Vermont Virginia D.C. Washington West Virginia Wisconsin Wyoming

The analysis on Monday showed Sec. Hillary Clinton leading Donald Trump with a greater than 99.9% probability of winning an election held now, and with a mean electoral vote of 338 for Clinton to 200 for Trump.

We’ve gotten about 49 new polls since then. A Monte Carlo analysis with 100,000 simulated elections has Clinton winning all 100,000 times. In an election held now, Clinton would have a greater than 99.9% probability of winning and Trump would have a less than 0.01% probability of winning. Clinton received (on average) 338 to Trump’s 200 electoral votes.

In other words, even with plenty of new polls, the race has stabalized.

The long term trends in this race can be seen from a series of elections simulated every seven days using polls from 20 Oct 2015 to 20 Oct 2016, and including polls from the preceding 21 days (FAQ).

An animated sequence of maps and electoral vote distributions can be seen here

Here is the distribution of electoral votes [FAQ] from the simulations:
[Read more…]

6 Stoopid Comments

Debate Three Open Thread

by Darryl — Wednesday, 10/19/16, 5:45 pm

Okay…here we go. Debate three has the potential to be insane. Please discuss.

[5:45] We have CNN on at the Roanoke Park Place Tavern. The banner says “BREAKING: Debate to start momentarily”. “Breaking”??? I don’t think so.

6:05: Play ball!

6:08: “My opponent said bad things about me and millions of people.” What the fuck is Trump babbling about. The question is about the Supreme Court!

6:10: Oooohhhh…he is talking about a Justice (bad audio here). Still…totally off-track to bring this up. Make him look petty as fuck.

We’re at the point in the campaign where Alec Baldwin looks more like Trump than Trump

— Taegan Goddard (@politicalwire) October 20, 2016

Right now Justice Scalia is in Heaven telling the Virgin Mary what she can & can't do with her own body. #Debatenight #SXM121

— John Fugelsang (@JohnFugelsang) October 20, 2016

“dozens of toddlers injure themselves, even kill people with guns.” – HRC, standing next to angry giant toddler.

— Karoli (@Karoli) October 20, 2016

6:19: Except for Trumps little tangent about Ginsburg, this is a pretty ordinary debate. Oops…Trump’s turn.

If Trump knew doctors other than Dr. Bongwater, he'd know "ripping a baby from the womb" in the 9th month is called CHILDBIRTH. #debatenight

— shauna (@goldengateblond) October 20, 2016

6:22: We have The Sniff.

6:24: Please, Hillary, no anecdotes.

6:25: Hillary is starting to troll Trump. Waiting for a Trump Sniff…er…meltdown.

6:27: Trump Tower built with undocumented workers–Clinton trolls again. Trump keeps it under control.

6:30: Wallace gets pissed at Clinton and he abandons his impartial role and points out her with bank speaker fees. Pathetic!

6:32: Donald is starting to go CRAZY with the SNIFFS! He’s rattled! Point Clinton!

6:33: Trump goes NUTZ!!!

6:35: Trump claims Clinton has been outsmarted worse than anyone ever. Of course…she beating him….

6:36: Clinton trolls over nuclear codes…Sniffles to follow.

6:37: Chris Wallace should ask candidates about their views instead of stating their views…

"I never made out with Putin." "Nobody ever said you did, Mr. Trump." "Because I didn't. And I don't even want to!"

— Seth Mnookin (@sethmnookin) October 20, 2016

6:40: Why does Trump deny knowing his “stablemate”, Putin?

Hillary mentioned that Trump used illegal workers to build Trump Tower. It's true, as @NickKristof wrote https://t.co/9kAb4cCpAI #debate

— NYT Opinion (@nytopinion) October 20, 2016

6:42: True fact: In 2008, Clinton stated in a debate against Obama, that she would renegotiate NAFTA.

HRC: Let me translate that if I can; DJT: You can't. I agree w/ DJT – that was incomprehensible. But if anyone can, it's HRC #Debate

— Michael Maddux (@michaeljmaddux) October 20, 2016

"Mr. Trump, how's your day?"
TRUMP: I don't know Putin! I've never met Putin! HE'S NOT MY BEST FRIEND!
"…"
"[sobbing] YOU'RE the puppet!"

— Adam Conover (@adamconover) October 20, 2016

6:47: Trump, “I pass factories”. Yep…Big Asshole!

6:49: Clinton trolls Trump again with shipping jobs to Mexico. He sniffs.

Uh, no, those sexual assault allegations have not been debunked. Saying "wrong!" is not debunking. #debate

— Boo-is Frightsman (@LouisPeitzman) October 20, 2016

6:57: “Nobody has more respect for women than I do.” The pub breaks out laughing.

6:58 Trump claims Clinton lied “hundreds of times to the FBI”. *SNIFF* I think that means he is lying.

HILLARY DESTROYING MAN-BABY TRUMP. Trump taking the bait every time. #debate #debatenight

— The Daily Edge (@TheDailyEdge) October 20, 2016

7:05: Clinton brings out the big guns, “…hasn’t released his tax returns.”

7:06: “Built with Chinese steel.” Ouch!

7:07: Concession question: Trump, “I’ll look it at the time” Totally disqualifying.

7:09: Trump: Clinton is guilty of a crime. Umm…no she isn’t. We have a constitutionally defined process for making this determination.

7:10: Trump (on no Emmy): “I should-a gotten it!” #whiner #wanker #notserious

Clinton hitting hard on list of things Trump has said are rigged: FBI, Iowa caucuses, Emmys. Trump: "Shoulda gotten it."

— Emily Flitter (@FlitterOnFraud) October 20, 2016

This IS a reality show. Will Trump concede the election? "I will keep you in suspense."

— James Oliphant (@jamesoliphant) October 20, 2016

"Well, that is horrifying," says Hillary, when Trump refuses to agree to a peaceful transition of power if he loses. #Debates2016

— Ashley Parker (@AshleyRParker) October 20, 2016

7:14: Fortunately, concession is a mere courtesy. It is totally unnecessary, although it sends a terrible message to the people.

7:17: Clinton points out Trump supported Iraq. He barks “wrong” twice in the exact same place he did last debate!!!

7:18: Clinton trolls Trump until he just blows up! Starts babbling.

7:19: Okay…now Trump is debating Chris Wallace. Cool.

"Let's turn to Aleppo."

Somewhere in New Mexico, Gary Johnson scowls and crushes an empty kombucha bottle. #debate

— daveweigel (@daveweigel) October 20, 2016

7:20: 🎼 ♫ If you’ve ever seen Aleppo clap your hands. ♪

Quite the difference in how Wallace addresses them. To HRC: some tough policy qs. To DJT: a summer-school teacher with a kid high on glue.

— Ana Marie Cox (@anamariecox) October 20, 2016

7:26: I wonder if Trump thinks GDP stands for “Good Damn P***Y”

7:27: “…and the unicorns will, once again, roam the great plains.”

Trump needed a big win tonight in this debate, instead, he looked like a little boy. Congratulations Madam President! #DebateNight #Debate

— Left Out Loud (@LeftOutLoud) October 20, 2016

7:31 :Trump has no clue about the issues facing Social Security.

7:32: Trump says he is happy that health insurance premiums are going up. #gofuckyourself

Things Donald Trump has called rigged. Also, in related news, I know you are but what am I. #growupDonald #debatenight pic.twitter.com/NhYd0AgmIh

— Bros4Hillary (@Bros4Hillary) October 20, 2016

7:37: Trump: “All she has done is talk to THE African Americans” #ThatsHowRacistsTalk

Conclusion: all anyone is going to talk about is Donald’s refusal to commit to concession. But the fact is, this is the least important thing about this debate. Concession is a tradition, but has no legal or constitutional meaning. It is just a convention and courtesy. The only person who will suffer from a lack of concession will be Mr. Trump.

I hope the media and social media gets past this and talks about important things.

"No one respects women more than I do" Later says 'Such a nasty woman' #DebateNight pic.twitter.com/c9bU3G7o6o

— FashionweekNYC (@FashionweekNYC) October 20, 2016

71 Stoopid Comments

Poll Analysis: Small changes

by Darryl — Monday, 10/17/16, 4:57 pm

Clinton
Trump
> 99.9% probability of winning
< 0.01% probability of winning
Mean of 338 electoral votes
Mean of 200 electoral votes


Electoral College Map

Alabama Alaska Arizona Arkansas California Colorado Connecticut Delaware Florida Georgia Hawaii Idaho Illinois Indiana Iowa Kansas Kentucky Lousiana Maine Maryland Massachusettes Michigan Minnesota Mississippi Missouri Montana Nebraska Nevada New Hampshire New Jersey New Mexico New York North Carolina North Dakota Ohio Oklahoma Oregon Pennsylvania Rhode Island South Carolina South Dakota Tennessee Texas Utah Vermont Virginia D.C. Washington West Virginia Wisconsin Wyoming

Electoral College Map

Georgia Alaska Arizona Arkansas California Colorado Delaware Connecticut Florida Mississippi Alabama Hawaii Idaho Illinois Indiana Iowa Kansas Kentucky Louisiana Maine Maryland Massachusetts Michigan Minnesota Missouri Montana Nebraska Nevada New Hampshire New Jersey New Mexico New York North Carolina North Dakota Ohio Oklahoma Oregon Pennsylvania Rhode Island South Carolina South Dakota Tennessee Texas Utah Vermont Virginia D.C. Washington West Virginia Wisconsin Wyoming

The previous analysis from 4 days ago showed Sec. Hillary Clinton ahead of Donald Trump, with a >99.9% probability of winning an election last week. Clinton’s mean electoral vote total was 335 and Trump’s was 203.

With a pile of new polls released since then, things haven’t changed a whole lot. Now, after 100,000 simulated elections, Clinton wins all 100,000 times. Clinton received (on average) 338 (+3) to Trump’s 200 (-3) electoral votes. In an election held now, Clinton would still have a > 99.9% probability of beating Trump.

There are a few things to highlight for this analysis.

Two new polls have come in from Arizona, and Clinton leads each. The oldest poll is a tie, and the newest three have Clinton at +2%, +1%, and +2%. This slight lead has slightly raised Clinton’s probability of taking the state from 60.8% to 65.8%. This is barely better than a tie, but the fact that a Democrat is leading in Arizona is nothing short of remarkable.

In Colorado, two polls with Trump up age out, and one new poll is added. The four current polls have Clinton up +11%, +11%, +0% (tie), and +8%. Consequently, Clinton’s chances have gone from 81.8% to 98.9% of winning the state today.

clintontrump17sep16-17oct16colorado

We have nine current polls in Florida, and eight of the polls have Clinton up. The one new poll has her up +4%. Overall, Clinton’s chances go from 91.8% to 94.2% in Florida.

We see a slight shift in Georgia, where Trump’s chances have dropped from 98.7% to 93.2%. This is entirely an artifact of 6 old polls dropping out and a new one coming in. The new poll has Trump up by +5.5%.

Minnesota has shifted in Trump’s favor, on account of a new Gravis poll that has the state tied. The other two current polls have Clintion up by +6.9% and 6%. The Gravis poll looks like an outlier.

clintontrump17sep16-17oct16minnesota

Two new Nevada polls join five other polls. Clinton has small leads in five of the seven polls, and the other two are ties. Clinton’s chances rise from 76.6% to 82.9% in the state.

clintontrump17sep16-17oct16nevada

In North Carolina, one poll ages out and three new polls weigh in. Clinton leads in all nine current polls, typically with small leads. Her chances have gone up from a 86% to a 92.3% probability.

clintontrump17sep16-17oct16north-carolina

A new South Carolina poll has Trump leading by +15.4%, raising his chances to 100% from 76%.

Utah has had some interesting polling, including a tie last week. Today, a Rasmussen poll with Trump up +2% joined a third poll with Trump at +6% to raise his chances of winning from 76.9% to 81.4%.

The long term trends in this race can be seen from a series of elections simulated every seven days using polls from 17 Oct 2015 to 17 Oct 2016, and including polls from the preceding 21 days (FAQ).

An animated sequence of maps and electoral vote distributions can be seen here

Here is the distribution of electoral votes [FAQ] from the simulations:
[Read more…]

9 Stoopid Comments

Poll Analysis: Trump’s bad week doesn’t improve

by Darryl — Thursday, 10/13/16, 2:07 pm

Clinton
Trump
> 99.9% probability of winning
< 0.01% probability of winning
Mean of 335 electoral votes
Mean of 203 electoral votes


Electoral College Map

Alabama Alaska Arizona Arkansas California Colorado Connecticut Delaware Florida Georgia Hawaii Idaho Illinois Indiana Iowa Kansas Kentucky Lousiana Maine Maryland Massachusettes Michigan Minnesota Mississippi Missouri Montana Nebraska Nevada New Hampshire New Jersey New Mexico New York North Carolina North Dakota Ohio Oklahoma Oregon Pennsylvania Rhode Island South Carolina South Dakota Tennessee Texas Utah Vermont Virginia D.C. Washington West Virginia Wisconsin Wyoming

Electoral College Map

Georgia Alaska Arizona Arkansas California Colorado Delaware Connecticut Florida Mississippi Alabama Hawaii Idaho Illinois Indiana Iowa Kansas Kentucky Louisiana Maine Maryland Massachusetts Michigan Minnesota Missouri Montana Nebraska Nevada New Hampshire New Jersey New Mexico New York North Carolina North Dakota Ohio Oklahoma Oregon Pennsylvania Rhode Island South Carolina South Dakota Tennessee Texas Utah Vermont Virginia D.C. Washington West Virginia Wisconsin Wyoming

About 17 new polls have come out since the previous analysis a few days ago. Many of the polls were taken after last Friday’s release of Donald Trump having a candid discussion with Billy Bush. That isn’t to say Sec. Hillary Clinton is totally off the hook, as WikiLeaks has released a series of stolen staffer emails over the past week to some embarassment. They don’t seem to be getting much press attention, but perhaps they are starting to have an effect on the race.

Today, after 100,000 simulated elections, Clinton wins 99,979 times and Trump wins 21 times, and they are all Electoral College ties. Clinton received (on average) 335 to Trump’s 203 electoral votes. In an election held now, Clinton would have greater than a 99.9% probability of winning and Trump would have less than a 0.01% probability of winning. The results are an improvement for Clinton who previously had a 99.8% probability of winning and a mean electoral vote total of 328.

Here are the most notable changes.

In Alaska a new poll has Trump up +5.5% in addition to a poll that has him up +3%. Trump’s chances have risen to 90.2% from 71%.

An old Arizona poll drops out, leaving behind two polls, one tie and one with Clinton up +2%. The state has gone from a dead tie to Clinton with a 60.8% chance–still pretty close to a tie.

clintontrump13sep16-13oct16arizona

With the gain and loss of one poll, Florida moves a bit more into the Clinton column. She would win the state with a 91.8% probability today. A few days ago, her chances were 88.6%.

clintontrump13sep16-13oct16florida

Trump gains in Georgia, as polls age out. He was at 90.1% on Monday, now he is at a 98.7% chance.

In Iowa, one of two polls aged out giving Trump a small increase to 78.1% probability of taking the state now.

In Maine, three old polls age out and one newly released poll weighs in. The biggest change is that Trump’s chances in the 2nd Congressional District have dropped from 98.7% to 59.6%. Trump is +1.6% in ME-2 now.

clintontrump13sep16-13oct16maine-2

Nevada is very close. Of the five current polls, two are ties, and three give CLinton small leads (C+3%, C+1%, C+6%). Clinton jumps from a 68.5% (Monday) to a 76.6% probability of winning now.

clintontrump13sep16-13oct16nevada

One new Clinton+9% poll in New Hampshire pushes her chances in the state from 95.2% to 98.4%.

In North Carolina, a new poll enters and an old one leaves, changing Clinton’s chances from 75.3% on Monday to 86% today.

clintontrump13sep16-13oct16north-carolina

Clinton’s chances also have increased in Ohio, but only because an old Trump+6% poll has aged out. Trump drops from 85.9% to 68.3%.

clintontrump13sep16-13oct16ohio

Utah is the big surprise of the last few days. Both old polls with Trump at +15%, age out, and two new polls are released today. One is a tie at 26% each, the other has Trump at +6%. The result, Trump drops from 100% to a 76.9% chance of winning Utah today.

The long term trends in this race can be seen from a series of elections simulated every seven days using polls from 13 Oct 2015 to 13 Oct 2016, and including polls from the preceding 21 days (FAQ).

An animated sequence of maps and electoral vote distributions can be seen here

Here is the distribution of electoral votes [FAQ] from the simulations:
[Read more…]

3 Stoopid Comments

Poll Analysis: The Senate Flips

by Darryl — Tuesday, 10/11/16, 1:15 pm


Senate Democrats*
Senate Republicans
63.5% probability
36.5% probability
Mean of 50 seats
Mean of 50 seats

Electoral College Map

Alabama Alaska Arizona Arkansas California Colorado Connecticut Delaware Florida Georgia Hawaii Idaho Illinois Indiana Iowa Kansas Kentucky Lousiana Maine Maryland Massachusettes Michigan Minnesota Mississippi Missouri Montana Nebraska Nevada New Hampshire New Jersey New Mexico New York North Carolina North Dakota Ohio Oklahoma Oregon Pennsylvania Rhode Island South Carolina South Dakota Tennessee Texas Utah Vermont Virginia D.C. Washington West Virginia Wisconsin Wyoming

My previous analysis, some 2.5 weeks ago, showed control of the Senate in the hands of the Republicans with a 70.5% probability and a mean of 51 seats. We have had a plethora of new polls since then, and we have seen a big change at the top of the ballot.

Now, after 100,000 simulated elections, Democrats have a Senate majority 28,826 times, there were 34,688 ties, and Republicans control the Senate 36,486 times. If we presume the VP will be a Democrat (and this seems very likely), Democrats have a 63.5% probability of controlling the Senate and Republicans, a 36.5% probability of controlling the Senate.

Where have the changes come?

First, is Illinois, where we didn’t have much polling before. A new poll has Tammy Duckworth (D) leading Mark Kirk (R) by an astonishing 14.4% in a four-way race. Illinois moves from 81.1% chance to a 99.8% chance of electing the Democrat.

In Indiana, where Democrat Evan Bayh is up against Republican Todd Young, we have but a single current poll that has Bayh up +1%. The previous poll had Bayh up +4%, so the Democrat’s chances have dropped from 77.2% to 56.2%–just about a tie.

senate11sep16-11oct16indiana1

We have no new polling in Missouri, where Democrat Jason Kander is challenging the incumbent Sen. Roy Blunt (R). But two older polls have dropped out and we are left with one Emerson poll with Kander at +2%. Blunt’s chances have dropped from 97.4% to 35%.

New Hampshire has been a back-and-forth race between Democrat Maggie Hassan and Sen. Kelly Ayotte (R). Ayotte led in the last analysis with a 56.5% probability of winning. Five polls have aged out and four new one have been completed. Now she is up to 68.6% probability.

senate11sep16-11oct16new_hampshire2

In North Carolina, Democrat Deborah Ross is challenging Sen. Richard Burr (R). This race has seen a significant shift in the polling and Burr’s 91% probability of winning has changed to a 61.1% probability for Ross.

senate11sep16-11oct16north_carolina1

In Oregon, Sen. Kate Brown (D) is defending her seat against Republican Bud Pierce. The only polling in the last analysis was small and had her up +8%. A new poll has Brown up +15%. Consequently her chances have gone up to 100%.
Oops…I got the gubernatorial candidate names in the Senate file. So it is Mark Callahan (R) versus Sen. Ron Wyden (D). The poll numbers are correct, however, so the only polling in the last analysis was small and had him up +8%. A new poll has Wyden up +15%. Consequently his chances have gone up to 100%.

Pennsylvania is another state where an incumbent is endangered, with Democrat Katie McGinty leading Sen. Pat Toomey (R). Previously she had a 78.3% probability of taking the seat. The loss of five polls and the gain of seven new polls have shifted this a little, and now KcGinty has a 68.7% chance

senate11sep16-11oct16pennsylvania2

Here is the distribution of Senate seats from the simulations:*

This graphs shows the probability of at least each number of seats controlled by the Democrats:*

  • 100000 simulations: Democrats control the Senate 63.5%, Republicans control the Senate 36.5%.
  • Average ( SE) seats for Democrats: 49.9 ( 1.1)
  • Average (SE) seats for Republicans: 50.1 ( 1.1)
  • Median (95% CI) seats for Democrats: 50 (48, 52)
  • Median (95% CI) seats for Republicans: 50 (48, 52)

Expected outcomes from the simulations:

  • Democratic seats w/no election: 35
  • Independent seats w/no election: one
  • Republican seats w/no election: 30
  • Contested Democratic seats likely to remain Democratic: nine
  • Contested Republican seats likely to remain Republican: 18
  • Contested Democratic seats likely to switch: one
  • Contested Republican seats likely to switch: six

This table shows the number of Senate seats controlled for different criteria for the probability of winning a state:* Safe>0.9999, Strong>90%, Leans>60%, Weak>50%

Threshold Safe + Strong + Leans + Weak
Safe Democrat 42
Strong Democrat 5 47
Leans Democrat 3 3 50
Weak Democrat 1 1 1 51
Weak Republican 0 0 0 49
Leans Republican 1 1 49
Strong Republican 5 48
Safe Republican 43

This table summarizes the results by state. Click on the poll number to see the individual polls included for a state.

#
Sample
%
%
Dem
Rep
State
@
polls
size
Dem
Rep
% wins
% wins
AL 0 0 (0) (100)
AK 1 320 23.4 76.6 0.0 100.0
AZ 1 528 40.9 59.1 0.1 99.9
AR 2 1142 36.9 63.1 0.0 100.0
CA 2 1106 57.0 43.0 99.9 0.1
CO 7 4258 54.4 45.6 100.0 0.0
CT 1& 872 61.7 38.3 100.0 0.0
FL 10 5787 47.0 53.0 0.1 99.9
GA 5 2258 40.1 59.9 0.0 100.0
HI 0 0 (100) (0)
ID 0 0 (0) (100)
IL 3 1736 54.8 45.2 99.8 0.2
IN 1 498 50.6 49.4 56.2 43.8
IA 3 1428 42.1 57.9 0.0 100.0
KS 1& 495 40.4 59.6 0.2 99.8
KY 1& 440 43.2 56.8 2.4 97.6
LA 1& 794 34.6 65.4 0.0 100.0
MD 2 1015 67.7 32.3 100.0 0.0
MO 1 492 51.2 48.8 65.0 35.0
NV 7 3943 48.0 52.0 4.1 95.9
NH 5 2315 49.3 50.7 31.4 68.6
NY 1& 671 72.1 27.9 100.0 0.0
NC 12 6452 50.2 49.8 61.1 38.9
ND 0 0 (0) (100)
OH 5 2519 42.9 57.1 0.0 100.0
OK 0 0 (0) (100)
OR 1 1061 61.2 38.8 100.0 0.0
PA 11 5490 50.5 49.5 68.7 31.3
SC 1& 941 38.4 61.6 0.0 100.0
SD 0 0 (0) (100)
UT 1& 502 27.7 72.3 0.0 100.0
VT 1& 544 62.3 37.7 100.0 0.0
WA 2 1071 54.4 45.6 97.9 2.1
WI 4 2680 54.0 46.0 99.9 0.1

@ Current party in office
& An older poll was used (i.e. no recent polls exist).
*Analysis assume that the two independent candidates will caucus with the Democrats.

Details of the methods are given in the FAQ.

10 Stoopid Comments

Poll Analysis: Clinton has a very good week

by Darryl — Monday, 10/10/16, 9:10 pm

Clinton
Trump
99.8% probability of winning
0.2% probability of winning
Mean of 328 electoral votes
Mean of 210 electoral votes


Electoral College Map

Alabama Alaska Arizona Arkansas California Colorado Connecticut Delaware Florida Georgia Hawaii Idaho Illinois Indiana Iowa Kansas Kentucky Lousiana Maine Maryland Massachusettes Michigan Minnesota Mississippi Missouri Montana Nebraska Nevada New Hampshire New Jersey New Mexico New York North Carolina North Dakota Ohio Oklahoma Oregon Pennsylvania Rhode Island South Carolina South Dakota Tennessee Texas Utah Vermont Virginia D.C. Washington West Virginia Wisconsin Wyoming

Electoral College Map

Georgia Alaska Arizona Arkansas California Colorado Delaware Connecticut Florida Mississippi Alabama Hawaii Idaho Illinois Indiana Iowa Kansas Kentucky Louisiana Maine Maryland Massachusetts Michigan Minnesota Missouri Montana Nebraska Nevada New Hampshire New Jersey New Mexico New York North Carolina North Dakota Ohio Oklahoma Oregon Pennsylvania Rhode Island South Carolina South Dakota Tennessee Texas Utah Vermont Virginia D.C. Washington West Virginia Wisconsin Wyoming

There have been 32 new polls released since the previous analysis on 3 Oct. The polls are largely post-first debate, pre-second debate and have almost all been collected before last Friday’s release of the conversation between Billy Bush and Donald Trump.

For this analysis, I have reduced the window that defines “current polls” to ten days. As the pace of polling picks up, the window will shrink some more.

Today, after 100,000 simulated elections, Sec. Hillary Clinton wins 99,821 times and Trump wins 179 times (including the 23 ties). Clinton received (on average) 328 to Trump’s 210 electoral votes. In an election held now, Clinton would have a 99.8% probability of winning and Trump would have a 0.2% probability of winning.

This is a considerable shift from the 92.5% probability Clinton had in the last analysis. Also her mean electoral vote total has climbed from 300 to 328. That’s quite a jump for one week!

There are a few state changes worth noting.

In Alaska, a new poll has Trump up by only +3%. Previous older polls had Trump with stronger showings (+21% and +14.8%), so this is quite a change. Consequently, Trump’s chances have tumbled from 100% to 71%. I don’t believe Clinton is a serious contender in Alaska, but we only have one small poll for the state, so that is what the available evidence tells us.

Two new Arizona polls don’t favor Trump. We now have three current polls for the state, one has Trump up +2, one is tied, and the most recent has Clinton up +2%. The state is 50-50 (percent) right now. Did I mention that this is Arizona?

A handful of polls favoring Trump have aged out and some new polls have been released. We now have eight polls, six that favor Clinton (+4%, +0.2%, +5%, +4%, +2%, and +3%), and two that favor Trump (+1.4% and +1%). Clinton’s chances have gone from 62.9% to 88.6%. Clearly, the state is quite close, but Clinton seems to be gaining, if slowly.

The previous analysis had Trump running strong in Iowa with a 93.5% chance of winning. The two current polls have Trump up +4% and Clinton up +0.6%, so Trump’s chances drop to 71.6%.

Nevada is another very close state. Last week, Clinton had a 52.4% probability of winning. The five current polls have one tie, three small leads for Clinton, and one for Trump. Clinton’s chances are pegged at 68.5% now.

One bit of positive news for Trump is in New Hampshire where poll turn-over has favored him slightly. He went from a 0.9% chance to 4.8% chance of taking the state.

New Mexico was modestly strong with Clinton at 77.3% chance last week with one poll with her up +4%. That poll is joined by a new one having her up a remarkable +13.5%. Her chances are now 99.3%.

Of the nine current polls in North Carolina, Clinton has small leads in the last eight. This raises her chances from last week from 56.7% to 75.3%.

Ohio has been Trump territory recently. But the most recent poll has Clinton up +2%. Combined with the three other polls (Trump +5%, +1%, and +6%), Trump’s chances have dropped from 94.8% to 85.9%.

In South Carolina, Trump drops from 100% to 77.6% because an old poll at Trump+15.4%, aged out. The remaining poll is Trump+4%. We simply need more polls in the state.

Something similar happens in Texas, where two old poll drops out and one new one is released. Trump goes from 97.2% down to 93.1% chance of winning.

A new Washington state poll has Clinton at +17%, joining another poll with Clinton at +5.7. Clinton goes from 87.5% chance to 99.9%.

In Wisconsin, an old poll drops out (Clinton+3%), one remains (Clinton+6.3), and two new polls join them (Clinton +8% and +9.6%). Clinton’s chances rise from 92% to 99.8% in Wisconsin.

The long term trends in this race can be seen from a series of elections simulated every seven days using polls from 10 Oct 2015 to 10 Oct 2016, and including polls from the preceding 21 days (FAQ).

An animated sequence of maps and electoral vote distributions can be seen here

Here is the distribution of electoral votes [FAQ] from the simulations:
[Read more…]

34 Stoopid Comments

  • « Previous Page
  • 1
  • …
  • 16
  • 17
  • 18
  • 19
  • 20
  • …
  • 96
  • Next Page »

Recent HA Brilliance…

  • Drinking Liberally — Seattle Tuesday, 10/14/25
  • Monday Open Thread Monday, 10/13/25
  • Friday Night Multimedia Extravaganza! Friday, 10/10/25
  • Friday Open Thread Friday, 10/10/25
  • Was This What the Righties Wanted All Along? Thursday, 10/9/25
  • Wednesday Open Thread Wednesday, 10/8/25
  • Drinking Liberally — Seattle Tuesday, 10/7/25
  • Monday Open Thread Monday, 10/6/25
  • Friday Night Multimedia Extravaganza! Friday, 10/3/25
  • Drinking Liberally — Seattle Tuesday, 9/30/25

Tweets from @GoldyHA

I no longer use Twitter because, you know, Elon is a fascist. But I do post occasionally to BlueSky at @goldy.horsesass.org

From the Cesspool…

  • EvergreenRailfan on Drinking Liberally — Seattle
  • XX Chromosone on Drinking Liberally — Seattle
  • XY Chromosome on Drinking Liberally — Seattle
  • Yes, release the Epstein files! on Drinking Liberally — Seattle
  • teh babblin' butthole on Drinking Liberally — Seattle
  • Roger Rabbit on Drinking Liberally — Seattle
  • Release the Epstein Files on Drinking Liberally — Seattle
  • lmao on Monday Open Thread
  • EvergreenRailfan on Monday Open Thread
  • Alpha Male on Monday Open Thread

Please Donate

Currency:

Amount:

Archives

Can’t Bring Yourself to Type the Word “Ass”?

Eager to share our brilliant political commentary and blunt media criticism, but too genteel to link to horsesass.org? Well, good news, ladies: we also answer to HASeattle.com, because, you know, whatever. You're welcome!

Search HA

Follow Goldy

I no longer use Twitter or Facebook because Nazis. But until BlueSky is bought and enshittified, you can still follow me at @goldy.horsesass.org

HA Commenting Policy

It may be hard to believe from the vile nature of the threads, but yes, we have a commenting policy. Comments containing libel, copyright violations, spam, blatant sock puppetry, and deliberate off-topic trolling are all strictly prohibited, and may be deleted on an entirely arbitrary, sporadic, and selective basis. And repeat offenders may be banned! This is my blog. Life isn’t fair.

© 2004–2025, All rights reserved worldwide. Except for the comment threads. Because fuck those guys. So there.