HorsesAss.Org

  • Home
  • About HA
  • Advertise
  • Archives
  • Donate

Search Results for: 10,000

Poll Analysis: Romney takes back a couple more

by Darryl — Wednesday, 10/3/12, 3:09 pm


Obama Romney
100.0% probability of winning 0.0% probability of winning
Mean of 342 electoral votes Mean of 196 electoral votes

Electoral College Map

Alabama Alaska Arizona Arkansas California Colorado Connecticut Delaware Florida Georgia Hawaii Idaho Illinois Indiana Iowa Kansas Kentucky Lousiana Maine Maryland Massachusettes Michigan Minnesota Mississippi Missouri Montana Nebraska Nevada New Hampshire New Jersey New Mexico New York North Carolina North Dakota Ohio Oklahoma Oregon Pennsylvania Rhode Island South Carolina South Dakota Tennessee Texas Utah Vermont Virginia D.C. Washington West Virginia Wisconsin Wyoming

Electoral College Map

Georgia Alaska Arizona Arkansas California Colorado Delaware Connecticut Florida Mississippi Alabama Hawaii Idaho Illinois Indiana Iowa Kansas Kentucky Louisiana Maine Maryland Massachusetts Michigan Minnesota Missouri Montana Nebraska Nevada New Hampshire New Jersey New Mexico New York North Carolina North Dakota Ohio Oklahoma Oregon Pennsylvania Rhode Island South Carolina South Dakota Tennessee Texas Utah Vermont Virginia D.C. Washington West Virginia Wisconsin Wyoming

The previous analysis had President Barack Obama leading Gov. Mitt Romney by 344 to 194 electoral votes. Obama’s victory margin was “statistically significant,” as the analysis suggested he would win an election now with certainty.

There were a plethora of new polls released in the last couple of days. So now, after a Monte Carlo analysis using 100,000 simulated elections, informed entirely by state head-to-head polls, Obama wins 100,000 times and Romney wins 0 times. Obama receives (on average) 342 (-2) to Romney’s 196 (+2) electoral votes.

This is two consecutive analyses in which Mitt Romney has gained electoral votes. Is this the end of the Convention bump for Obama? Will Romney be able to keep adding a couple of electoral votes a day?

If so, with 34 days to go, he’d still lose by five—with only 264 electoral votes. In other words, to win, Romney needs to shake loose more than two electoral votes a day, on average, through election day.

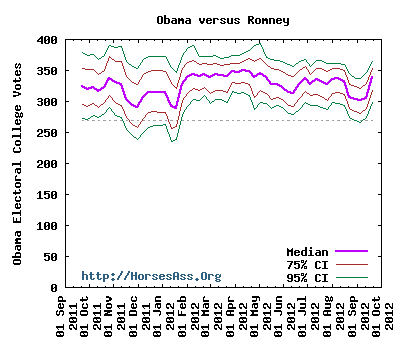
That’s the analysis. The big picture in this race can be seen from the time trends from a series of elections simulated every seven days using polls from 03-Oct-2011 to 03-Oct-2012, and including polls from the preceding 21 days (FAQ).

[Read more…]

2 Stoopid Comments

Poll Analysis: Obama Romney gains a bit

by Darryl — Sunday, 9/30/12, 7:23 pm


Obama Romney
100.0% probability of winning 0.0% probability of winning
Mean of 344 electoral votes Mean of 194 electoral votes

Electoral College Map

Alabama Alaska Arizona Arkansas California Colorado Connecticut Delaware Florida Georgia Hawaii Idaho Illinois Indiana Iowa Kansas Kentucky Lousiana Maine Maryland Massachusettes Michigan Minnesota Mississippi Missouri Montana Nebraska Nevada New Hampshire New Jersey New Mexico New York North Carolina North Dakota Ohio Oklahoma Oregon Pennsylvania Rhode Island South Carolina South Dakota Tennessee Texas Utah Vermont Virginia D.C. Washington West Virginia Wisconsin Wyoming

Electoral College Map

Georgia Alaska Arizona Arkansas California Colorado Delaware Connecticut Florida Mississippi Alabama Hawaii Idaho Illinois Indiana Iowa Kansas Kentucky Louisiana Maine Maryland Massachusetts Michigan Minnesota Missouri Montana Nebraska Nevada New Hampshire New Jersey New Mexico New York North Carolina North Dakota Ohio Oklahoma Oregon Pennsylvania Rhode Island South Carolina South Dakota Tennessee Texas Utah Vermont Virginia D.C. Washington West Virginia Wisconsin Wyoming

Even Newer Update: There is a real North Dakota poll that has just been released. It shows Romney leading in N.D. by 51% to 39%. The poll fails my inclusion criteria because it was conducted on behalf of the North Dakota Democratic-NPL State Party. But there you have it.

Newer Update: Okay…stuff should be fixed now.

Update: OOPS! As was pointed out in the comment thread, I accidentally “invented” a new poll that turned N.D. blue! Alas, it was an Ohio poll that got entered for the wrong state (and then entered again for Ohio). I’ll do a new analysis soon.

The analysis a few days ago showed President Barack Obama leading Governor Mitt Romney by, on average, 345 to 193 electoral votes. Since then, we’ve had a plethora of new polls released, and the result is a small gain for Obama Romney.

Here are the new polls:

start end sample % % %
st poll date date size MOE O R diff
AZ Moore 25-Sep 26-Sep 500 4.0 42 46 R+4
IA Iowa Poll 23-Sep 26-Sep 650 3.8 49 45 O+4
IA VCR 23-Sep 25-Sep 500 4.4 46 47 R+1
ME Rasmussen 25-Sep 25-Sep 500 4.5 52 40 O+12
MA Boston Globe 21-Sep 27-Sep 502 4.4 57 30 O+27
MI Gravis Marketing 21-Sep 22-Sep 804 3.3 50.0 46.2 O+3.8
MI PPP 17-Sep 19-Sep 2386 2.0 51 42 O+9
NV Marist 23-Sep 25-Sep 984 3.1 49 47 O+2
NH ARG 25-Sep 27-Sep 600 4.0 50 45 O+5
NH Marist 23-Sep 25-Sep 1012 3.1 51 44 O+7
NM PPP 17-Sep 20-Sep 3111 1.8 52 43 O+9
NC Marist 23-Sep 25-Sep 1035 3.1 48 46 O+2
OH Columbus Dispatch 19-Sep 29-Sep 1662 2.2 51 42 O+9
OH PPP 14-Sep 18-Sep 2890 1.8 50 44 O+6
PA Muhlenberg 22-Sep 26-Sep 427 5.0 49 42 O+7
PA PPP 17-Sep 18-Sep 2051 2.2 52 40 O+12
VA ARG 24-Sep 27-Sep 600 4.0 49 47 O+2
VA Suffolk 24-Sep 26-Sep 600 4.0 45.7 44.0 O+1.7
VA PPP 17-Sep 19-Sep 2770 1.9 49 43 O+6
WA Rasmussen 26-Sep 26-Sep 500 4.5 52 41 O+11

Romney continues to out poll Obama in Arizona. The three current polls, taken together, has Romney with a 95% probability of winning the state.

In Iowa, Obama leads by +4% in one poll and trails by -1% in another. Still, there are six Iowa polls taken in the past three weeks—Obama leads in four. Together they put Obama’s probability of taking the state (now) at 98%. Here is the last three months of polling:

ObamaRomney30Aug12-30Sep12Iowa

Maine has Obama leading by +12% in the new poll. There is also a newly released Critical Insights poll that is a couple weeks old and has Obama up by +16. I didn’t see the poll until after the analyses were running; it’ll be included in subsequent analyses.

Obama hangs on to a small +3.8% in one new Michigan poll. Even so, Obama pulls over 50%. Another huge, but somewhat older, Michigan poll has Obama up by +9. With Obama leading in all eight current polls, by double digits in three of them, Obama is looking unbeatable in this state.

In Nevada, Obama’s lead is just +2% in the current poll. Romney hasn’t won any of the six current polls, and Obama would be expected to win the state now with a 95% probability.

Two new New Hampshire polls have Obama up by +5% and +7%. These are Obama’s strongest showing, now giving him three of the four current polls. Romney’s chances in the state have shrunk to about 10%.

Another North Carolina poll goes Obama’s way, but by only a +2% edge. Obama now has a streak of four consecutive polls in his favor, and he takes four of the five current polls for the state. Here is what the last three months of polling look like graphically:

ObamaRomney30Aug12-30Sep12North Carolina

Two more Ohio polls go to Obama, who leads in all 12 of the polls taken over the past three weeks. In 2008, Obama won Ohio by +4.6%. If the election was held now, we’d expect Obama to win by more than a +6% margin! Here’s the recent trend:
ObamaRomney30Aug12-30Sep12Ohio

Pennsylvania shows, once again, that it isn’t a swing state. Obama’s +7% and +12% in the new polls fall in line with the rest of the ten current polls.

In Virginia, Obama has a puny +2% lead in two polls and a +6% lead in another. These polls make eleven taken in the past three weeks and Obama leads in every one of them. The analysis suggests Obama would win the hypothetical election now with certainty, even if by a smallish margin. The polling trend makes this apparent:

ObamaRomney30Aug12-30Sep12Virginia

Last, but not least, we get a new Rasmussen poll in Washington, where Obama leads Romney by a solid +11%, and takes 52% of the vote. All three current polls are double digit leads for Obama…this new poll is the smallest lead.

Now, after a Monte Carlo analysis using 100,000 simulated elections, Obama receives (on average) 347 (+2) 344 (-1) to Romney’s 191 (-2) 194 (+1) electoral votes. Obama won all 100,000 of the simulated elections, suggesting he would certainly win a hypothetical election held now.

We can view the long term trend of this race from a series of elections simulated every seven days using polls from 30 Sep 2011 to 30 Sep 2012, and including polls from the preceding 21 days (FAQ).

Looking at the media electoral vote line (purple), we see that Obama’s position is stronger than at any time in the past year tied with his strongest position over the past year (median of 347 electoral votes).

Here is the distribution of electoral votes [FAQ] from the simulations:
[Read more…]

16 Stoopid Comments

Poll Analysis: Romney slips a bit

by Darryl — Thursday, 9/27/12, 12:18 pm


Obama Romney
100.0% probability 0.0% probability
345 electoral votes 193 electoral votes


Electoral College Map

The previous analysis showed President Barack Obama leading Governor Mitt Romney by an average of 341 to 197 electoral votes. The results were strong enough and certain enough that we would expect Obama to be the certain winner in an election held now.

Over the past two days, 14 new polls have been released, covering 12 states.

The net result is that, after 100,000 simulated elections, Obama wins 100,000 times and Romney wins 0 times. Obama receives (on average) 345 to Romney’s 193 electoral votes. That is a gain of +4 EVs based on the new polls and the “aging out” of some older polls. We’d have to say the the evidence is quite strong that Obama would achieve victory in a hypothetical election held today.

Here are the new polls, followed by a discussion of some of the changes over the past couple of days:

start end sample % % %
st poll date date size MOE O R diff
AZ Rasmussen 25-Sep 25-Sep 500 4.5 42 52 R+10
CO Gravis Marketing 21-Sep 22-Sep 765 3.4 50.2 45.5 O+4.7
CT PPP 24-Sep 26-Sep 801 3.5 54 41 O+13
FL Insider Advantage 24-Sep 24-Sep 540 4.1 49 46 O+3
FL Quinnipiac 18-Sep 24-Sep 1162 3.0 53 44 O+9
IN Bellweather Research 19-Sep 20-Sep 800 3.5 40 52 R+12
IA PPP 24-Sep 26-Sep 754 3.6 51 44 O+7
MD Gonzales Res 17-Sep 23-Sep 813 3.5 55 36 O+19
MA Rasmussen 24-Sep 24-Sep 500 4.5 55 40 O+15
MO Chilenski Strategies 20-Sep 20-Sep 817 3.4 44.3 50.2 R+5.9
OH Quinnipiac 18-Sep 24-Sep 1162 3.0 53 43 O+10
PA Quinnipiac 18-Sep 24-Sep 1162 3.0 54 42 O+12
PA Franklin & Marshall 18-Sep 23-Sep 392 4.9 52 43 O+9
WA Gravis Marketing 21-Sep 22-Sep 625 4.6 56.4 38.6 O+17.8

There are a couple of bright spots for Romney, including a poll from Arizona that has Romney up by a +10%. Romney’s lead in the previous AZ poll was only +3%. The three current polls, taken together bump Romney’s chances of taking the state from 97.5% to 99.3% in an election now.

In Colorado, Obama has a +4.7% lead in the latest poll. Obama gets a slight bump from 95% to 96% probability of taking the state (for now) from the poll.

Two more Florida polls go to Obama. He gets a +3% in one and a +9% in the other. Taken together the 15 current polls suggest a 99% chance of Obama taking the state—up from a 93% probability without these two new polls.

Indiana has Romney up by a respectable +12% over Obama. Indiana barely went for Obama in 2008. It seems unlikely the state will repeat that in 2012.

Another Iowa poll goes Obama’s way, this time by +7%. Romney has only led in one of the four current polls taken over the past three weeks. Taken together, Obama gets a slight bump from 95% to 98% of taking the state now.

The other bright spot for Romney is Missouri, where Romney leads in a new poll by +5.9%. Together, the two current polls bump Romney’s chances from 68% to 90% of taking the state now.

Another Ohio poll goes to Obama, this one by double digits. This gives us 12 polls in Ohio over the past three weeks and every one of them goes to Obama. As a result, Obama won all 100,000 simulated elections in that state.

Two new Pennsylvania polls both go to Obama. One by +12% and the other by +9%. The eight current polls all go to Obama. The give Obama, in aggregate, a +9% lead over Romney, and suggest Obama would take the state with certainty in an election right now.

A new poll for Washington state has Obama leading Romney by +17.8%. The five current polls all give Obama double digit leads in the state.

Here is the distribution of electoral votes [FAQ] from the simulations:
[Read more…]

51 Stoopid Comments

Poll Analysis: Romney drops below 200 EVs

by Darryl — Tuesday, 9/25/12, 1:21 pm


Obama Romney
100.0% probability of winning 0.0% probability of winning
Mean of 341 electoral votes Mean of 197 electoral votes

Beginning this analysis, I’ve narrowed the “current polling window.” The old window included all polls taken within the past month. That criterion resulted in some states with many “current” polls, including some pre-conventions polls.

The new criterion is three weeks, so that almost all the polling occurs after the conventions. You can expect the window to shrink to two weeks sometime in October.

There are two effects from shrinking the window. First, the number of individuals polled goes down for some states. With fewer respondents, we have less evidence and, therefore, uncertainty increases (all else being equal).

The other effect is that there is less smoothing of the results. That is, the results become more indicative of trends.

Taken together, we might expect that Governor Mitt Romney’s chances improve through the increase in uncertainty. We can also expect Romney’s chances to decrease as a result of a recent poll surge for Obama. As it happens, the latter has a much stronger effect. The net effect is that Romney takes a beating….

The previous analysis had Obama leading Romney by 331 to 207 electoral votes, and the analysis suggested that Obama would almost certainly win an election held now.

Nineteen new polls covering 13 states have appeared in the past two days. Additionally, I’ve found four older polls (one each in AL, CO, OH, and FL) by comparing my database against Samuel Minter’s database.

Here are the new polls:

start end sample % % %
st poll date date size MOE O R diff
AR Talk Business-Hendrix College 17-Sep 17-Sep 2228 2.0 34.5 55.5 R+21.0
CO PPP 20-Sep 23-Sep 940 3.2 51 45 O+6
FL PPP 20-Sep 23-Sep 861 3.3 50 46 O+4
FL WA Post 19-Sep 23-Sep 769 4.5 51 47 O+4
FL ARG 20-Sep 22-Sep 600 4.0 50 45 O+5
IA ARG 20-Sep 23-Sep 600 4.0 51 44 O+7
MI Rasmussen 20-Sep 20-Sep 500 4.5 54 42 O+12
MN Mason-Dixon 17-Sep 19-Sep 800 3.5 48 40 O+8
MT Mason-Dixon 17-Sep 19-Sep 625 4.0 42 51 R+9
NV ARG 20-Sep 23-Sep 600 4.0 51 44 O+7
NV NV Retailers 19-Sep 20-Sep 500 4.4 46 46 tie
NV PPP 18-Sep 20-Sep 501 4.4 52 43 O+9
NJ Monmouth 19-Sep 23-Sep 613 4.0 52 37 O+15
NC Civitas 18-Sep 19-Sep 600 4.0 49 45 O+4
OH Gravis Marketing 21-Sep 22-Sep 594 4.3 45.3 44.3 O+1.0
OH WA Post 19-Sep 23-Sep 759 4.5 52 44 O+8
PA Susquehanna 18-Sep 20-Sep 800 3.5 47 45 O+2
PA Mercyhurst U 12-Sep 20-Sep 522 4.3 48 40 O+8
WI WeAskAmerica 20-Sep 23-Sep 1238 2.8 52.5 41.0 O+11.5

With this new poll, seven of eight current Colorado polls go to Obama suggesting he would win an election now with about a 95% probability. One can sense from the last three months of polling that Obama is gaining slowly in the state:

ObamaRomney25Aug12-25Sep12Colorado

Florida has Obama up by +4% in two new polls and +5 in another. Obama has now led in five consecutive polls in the state. That trend we can almost discern in Colorado is even more apparent in Florida:
ObamaRomney25Aug12-25Sep12Florida

Romney took the previous Iowa poll, but this new one goes +7% for Obama. The three current polls, take together, suggest Obama has a 95% chance of taking the state right now.

Another solid Michigan poll for Obama leaves him with a certain win in the state (at least, for now).

Three new Nevada polls have Obama up by +7%, +9%, and +0% (i.e. tied). It looks like Obama is regaining the lead he held there six months ago:
ObamaRomney25Aug12-25Sep12Nevada

The Civitas Institute is a right wing think tank in North Carolina, but they release all their polls. This one has Obama leading by +4%. Obama leads in four of the six current polls and the last three in a row. Still, the weight of evidence goes very slightly to Romney. The trend seems to be in Obama’s favor:

ObamaRomney25Aug12-25Sep12North Carolina

Two new Ohio polls favor Obama, one by a whisper, the other by +8%. Looking at the three month polling trend in the state, the past few weeks have not been kind to Romney:
ObamaRomney25Aug12-25Sep12Ohio

Obama gets his best and his worst poll in recent months in today’s Pennsylvania collection. Still, it is hard to argue that Obama’s lead isn’t solid:

ObamaRomney25Aug12-25Sep12Pennsylvania

Finally, a double-digit lead for Obama in Wisconsin caps off a very favorable collection of recent polls in the state for the President. Whatever momentum Romney had in the state in August seems to have almost entirely vanished:
ObamaRomney25Aug12-25Sep12Wisconsin

Now after 100,000 simulated elections, Obama wins 100,000 times and Romney wins 0 times. Obama receives (on average) 341 (+10) to Romney’s 197 (-10) electoral votes. In a hypothetical election held now, Obama would have a 100.0% probability of winning.

Electoral College Map

Alabama Alaska Arizona Arkansas California Colorado Connecticut Delaware Florida Georgia Hawaii Idaho Illinois Indiana Iowa Kansas Kentucky Lousiana Maine Maryland Massachusettes Michigan Minnesota Mississippi Missouri Montana Nebraska Nevada New Hampshire New Jersey New Mexico New York North Carolina North Dakota Ohio Oklahoma Oregon Pennsylvania Rhode Island South Carolina South Dakota Tennessee Texas Utah Vermont Virginia D.C. Washington West Virginia Wisconsin Wyoming

Electoral College Map

Georgia Alaska Arizona Arkansas California Colorado Delaware Connecticut Florida Mississippi Alabama Hawaii Idaho Illinois Indiana Iowa Kansas Kentucky Louisiana Maine Maryland Massachusetts Michigan Minnesota Missouri Montana Nebraska Nevada New Hampshire New Jersey New Mexico New York North Carolina North Dakota Ohio Oklahoma Oregon Pennsylvania Rhode Island South Carolina South Dakota Tennessee Texas Utah Vermont Virginia D.C. Washington West Virginia Wisconsin Wyoming

[Read more…]

29 Stoopid Comments

Poll Analysis: SC magically turns red!

by Darryl — Sunday, 9/23/12, 4:33 pm


Obama Romney
100.0% probability of winning 0.0% probability of winning
Mean of 331 electoral votes Mean of 207 electoral votes

Electoral College Map

Alabama Alaska Arizona Arkansas California Colorado Connecticut Delaware Florida Georgia Hawaii Idaho Illinois Indiana Iowa Kansas Kentucky Lousiana Maine Maryland Massachusettes Michigan Minnesota Mississippi Missouri Montana Nebraska Nevada New Hampshire New Jersey New Mexico New York North Carolina North Dakota Ohio Oklahoma Oregon Pennsylvania Rhode Island South Carolina South Dakota Tennessee Texas Utah Vermont Virginia D.C. Washington West Virginia Wisconsin Wyoming

Electoral College Map

Georgia Alaska Arizona Arkansas California Colorado Delaware Connecticut Florida Mississippi Alabama Hawaii Idaho Illinois Indiana Iowa Kansas Kentucky Louisiana Maine Maryland Massachusetts Michigan Minnesota Missouri Montana Nebraska Nevada New Hampshire New Jersey New Mexico New York North Carolina North Dakota Ohio Oklahoma Oregon Pennsylvania Rhode Island South Carolina South Dakota Tennessee Texas Utah Vermont Virginia D.C. Washington West Virginia Wisconsin Wyoming

I’ve finally succumbed to the pressure of “doing something about South Carolina.” The last straw was Goldy harassing me over the phone for the umpteenth time this past week. So, I caved and changed the inclusion criteria for states lacking “current polls.” Note that I did not simply drop the vexing S.C. poll, but the new inclusion criteria means that when there are no current polls, multiple old polls will be pooled.

Here is what I have been doing: If a state does not have a “current poll”, I use the single most recent poll available. Right now, the definition of “current poll” is any poll taken over the past month (this “window” will shrink as the election approaches and the pace of polling increases).

That simple rule worked pretty well in 2008. But a single, large poll in South Carolina has plagued these analyses since late last year. The poll is perfectly valid, and might even be correct in giving Obama an 85% probability of winning the state. But it is quite old, and there are other slightly older polls in the state that contradict it. What’s an analyst to do?

I modified a suggestion from Richard Pope and used an inclusion window for older polls, the length of which depends on how old the most recent poll is. Here his the new rule set:

  1. Use only polls taken in the “current polling window” (one month, right now)
  2. If the most recent poll is outside the current polling window and less than 3 months old, use that poll and any others taken over the prior two weeks
  3. if the most recent poll is 3-6 months old, use that polls and any others from the prior month
  4. if the most recent poll is 6-9 months old, use that poll and any other from the prior three months
  5. if the most recent poll is 9-12 months old, use that poll and any other from the prior six months
  6. if the most recent poll is more than a year old, use that poll and any other from the prior year

There are several disadvantages of this new rule set: First, it is complicated. As you know, I strive to minimize arbitrary assumptions in the methods, but now I’ve gone and added a complex, arbitrary rule. Yuck. Another disadvantage is that the new rules will tend to overestimate the winning certainty for states with multiple old polls included in an analysis. On the other hand, a state that hasn’t been polled in a long time probably hasn’t been polled much, so most of the time the single most recent poll will still be used. South Carolina is an exception. There were a bunch of polls taken late last year. I believe this happened because there was “piggyback” polling of the general election by pollsters covering the contentious G.O.P. primary in that state.

Okay…so let’s get to it. Just three days ago the analysis had President Barack Obama leading Gov. Mitt Romney by 336 to 202 electoral votes. The results suggested that, if an election was held now, Obama would almost certainly win.

In the three days since my previous analysis, there have been some 19 new polls (plus, I am including an old poll, previously overlooked). Here are the polls:

start end sample % % %
st poll date date size MOE O R diff
AZ Purple Poll 15-Sep 19-Sep 600 4.0 45 48 R+3
CA PPIC 09-Sep 16-Sep 995 4.4 53 39 O+14
CO Purple Poll 15-Sep 19-Sep 600 4.0 48 45 O+3
CO Marist 16-Sep 18-Sep 971 3.1 50 45 O+5
FL Mason-Dixon 17-Sep 19-Sep 800 3.5 48 47 O+1
FL Purple Poll 15-Sep 19-Sep 600 4.0 47 48 R+1
GA InsiderAdvangage 18-Sep 18-Sep 483 4.5 35 56 R+21
IA Marist 16-Sep 18-Sep 898 3.3 50 42 O+8
NE Wiese Res 17-Sep 20-Sep 800 3.5 40 51 R+11
NE2 Wiese Res 17-Sep 20-Sep 400 4.9 44 44 tie
NC Purple Poll 15-Sep 19-Sep 600 4.0 48 46 O+2
NC High Point 08-Sep 18-Sep 448 4.7 48 44 O+4
OH Purple Poll 15-Sep 19-Sep 600 4.0 48 44 O+4
OH FOX News 16-Sep 18-Sep 1009 3.0 49 42 O+7
OH Ohio Poll 13-Sep 18-Sep 861 3.3 51 45 O+6
OH Gravis Marketing 07-Sep 08-Sep 1548 2.7 47.3 43.2 O+4.1
PA Rasmussen 19-Sep 19-Sep 500 4.5 51 39 O+12
SD Neilson Brothers 29-Aug 06-Sep 512 4.3 38.7 53.9 R+15.2
VA Purple Poll 15-Sep 19-Sep 600 4.0 46 43 O+3
WI Marist 16-Sep 18-Sep 968 3.2 50 45 O+5

The race seems to tighten in Arizona where Romney just squeaks by with a +3%. Also, this is the first time since early June that Romney has been under 50%.

On the other hand, California tightens as well. Obama gets +14% where he used to pull in the low +20%.

Another pair of Colorado polls go to Obama, who leads in seven of the eight current polls, and seems to have a 91% chance of taking the state (in an election held now).

Florida gives each candidate a poll, by +1%. From twelve polls pooled over the past month, the ~11,000 responses go to Obama 50.8% of the time and to Romney 49.2% of the time. That translates into an 88% probability that Obama would win the state now.

The good news for Romney is that Georgia shows the strongest result for him this year.

Iowa has a strong +8% result for Obama. This poll was taken slightly before the Rasmussen poll I included last analysis that had Romney up by +3%. Even so, with Obama taking two of the three current polls, Obama would seem to have an 89% chance of taking the state right now.

We finally have some polling in Nebraska, where Romney bests Obama by +11%. That the good news for Romney. Recall that Nebraska assigns one elector to the winner of each CD, and the overall state winner gets the other two electors. The bad news for Romney is that Nebraska’s second congressional district polls at a 44% tie. Obama won NE-2 in 2008 and may do it again! (The polling report mentions that Romney has a solid lead in the other two CD’s, but the numbers are not given; instead, an older poll is used for those two CDs. Romney leads in both.)

Two new North Carolina polls go to Obama by small margins. Even so, Romney has led in five of nine current polls (and there was a tie). Overall, the pooled polls favor Romney with an 83% probability of winning an election held now.

With the three new Ohio polls, Obama has a streak of eight consecutive poll leads in the state. Obama won 99% of the simulated elections in the state.

A double-digit lead for Obama in the newest Pennsylvania poll. Obama has won all four of the state’s current polls.

South Dakota gives Romney his first double digit SC lead of the year.

Like Ohio, the new Virginia poll gives Obama a streak of eight consecutive poll leads in the state. But Obama only won 95% of the simulated elections in Virginia.

The new Wisconsin poll means Obama leads in all five current polls, and gives Obama a very high probability of taking the state (in a hypothetical election held now).

After a Monte Carlo analysis with 100,000 simulated elections, Obama wins 100,000 times and Romney wins 0 times. Obama receives (on average) 331 to Romney’s 207 electoral votes. Obama has a 100.0% probability of winning and Romney has a 0.0% probability of winning. And that is with South Carolina going to Romney 95% of the time.

Using the new “old poll inclusion criteria,” here is the picture of the race over time:
ObamaRomney23Sep11-23Sep12ex

Hmmm…it looks pretty much like the old one that used the simple “single most recent” rule.

[Read more…]

32 Stoopid Comments

Poll Analysis: A not-so-good week for Romeny

by Darryl — Thursday, 9/20/12, 7:00 pm


Obama Romney
100.0% probability of winning 0.0% probability of winning
Mean of 336 electoral votes Mean of 202 electoral votes

My previous Monte Carlo analysis, conducted one week ago, showed President Barack Obama leading Governor Mitt Romney by (on average) 306 to 232 electoral votes. If the election had been held last week, the analysis suggested that Obama would win with a 97.9% probability.

I guess I waited too long to do a new analysis, because the past week has brought us 47 new polls (plus a poll that breaks out Maine’s two congressional districts):

start end sample % % %
st poll date date size MOE O R diff
CA Field Poll 06-Sep 17-Sep 891 3.4 58 34 O+24
CO Rasmussen 17-Sep 17-Sep 500 4.5 45 47 R+2
CO Quinnipiac 11-Sep 17-Sep 1497 3.0 48 47 O+1
CO ARG 10-Sep 12-Sep 600 4.0 49 47 O+2
CO SurveyUSA 09-Sep 12-Sep 615 4.0 47 46 O+1
CT U CT 11-Sep 16-Sep 508 4.4 53 32 O+21
FL WeAskAmerica 18-Sep 18-Sep 1230 2.8 49.1 45.5 O+3.6
FL FOX News 16-Sep 18-Sep 829 3.0 49 44 O+5
FL Gravis Marketing 15-Sep 16-Sep 1728 2.5 47.1 47.7 R+0.6
IA Rasmussen 19-Sep 19-Sep 500 4.5 44 47 R+3
KY SurveyUSA 11-Sep 13-Sep 606 4.1 39 53 R+14
ME PPP 17-Sep 18-Sep 804 3.5 55 39 O+16
ME Maine PRC 15-Sep 17-Sep 856 3.4 53.5 37.3 O+16.2
ME1 Maine PRC 15-Sep 17-Sep 445 — 58.7 33.9 O+24.8
ME2 Maine PRC 15-Sep 17-Sep 410 — 47.8 41.0 O+6.8
MA WBUR 15-Sep 17-Sep 507 4.4 59 31 O+28
MA UMass-Lowell 13-Sep 17-Sep 497 5.5 59 36 O+23
MA Suffolk 13-Sep 16-Sep 600 4.0 63.5 30.5 O+33.0
MA PPP 13-Sep 16-Sep 876 3.3 57 39 O+18
MA WNEU 06-Sep 13-Sep 444 4.6 60 38 O+22
MI Detroit News 15-Sep 17-Sep 600 4.0 52.0 37.8 O+14.2
MI CNN 14-Sep 18-Sep 754 3.5 52 44 O+8
MI MRG 10-Sep 15-Sep 600 4.0 47.5 42.3 O+5.2
MI Baydoun 12-Sep 12-Sep 1156 2.9 45.5 43.7 O+1.8
NV Rasmussen 18-Sep 18-Sep 500 4.5 47 45 O+2
NV CNN 14-Sep 18-Sep 741 3.5 49 46 O+3
NH Rasmussen 18-Sep 18-Sep 500 4.5 45 48 R+3
NH ARG 15-Sep 17-Sep 463 4.5 48 47 O+1
NJ Philadelphia Inquirer 09-Sep 12-Sep 600 4.0 51 37 O+14
NJ Fairleigh Dickinson 06-Sep 12-Sep 706 3.8 52 38 O+14
NC Rasmussen 13-Sep 13-Sep 500 4.5 45 51 R+6
OH Rasmussen 12-Sep 12-Sep 500 4.5 47 46 O+1
OH ARG 10-Sep 12-Sep 600 4.0 48 47 O+1
OR SurveyUSA 10-Sep 13-Sep 552 4.3 49.5 40.7 O+8.9
PA WeAskAmerica 18-Sep 18-Sep 1214 2.9 48.1 42.2 O+5.9
PA Muhlenberg 10-Sep 16-Sep 640 4.0 50 41 O+9
PA Philadelphia Inquirer 09-Sep 12-Sep 600 4.0 50 39 O+11
VA FOX News 16-Sep 18-Sep 1006 3.0 50 43 O+7
VA WeAskAmerica 17-Sep 17-Sep 1238 2.8 48.5 45.7 O+2.8
VA PPP 13-Sep 16-Sep 1021 3.1 51 46 O+5
VA Quinnipiac 11-Sep 17-Sep 1474 3.0 50 46 O+4
VA WA Post 12-Sep 16-Sep 847 4.0 52 44 O+8
VA Rasmussen 13-Sep 13-Sep 500 4.5 49 48 O+1
WA Elway 09-Sep 12-Sep 405 5.0 53 36 O+17
WA SurveyUSA 07-Sep 09-Sep 524 4.4 54.4 37.6 O+16.8
WI PPP 18-Sep 19-Sep 842 3.4 52 45 O+7
WI Rasmussen 17-Sep 17-Sep 500 4.5 49 46 O+3
WI Marquette 13-Sep 16-Sep 601 4.1 54 40 O+14
WI Quinnipiac 11-Sep 17-Sep 1485 3.0 51 45 O+6

I’ll just comment briefly on some states. Overall, the week’s polling looks very good for Obama, but with a couple of minor exceptions.

Obama takes three of four Colorado polls. This suggests a slight but real lead in the state. The Monte Carlo analysis gave Obama an 84% probability of winning based on the seven current polls.

Obama comes out on top in Florida. He has led in seven of the eleven polls taken over the past month.

Iowa is one of the few bright spots for Romney. He leads Obama by +3% in this week’s poll. But Obama leads in the other current poll, and overall has a very slight edge.

Romney looks destined to loose his boyhood home state of Michigan that gives Obama leads in four polls ranging from +2% to +14%.

Nevada is looking blue, but not by much. Combined with one other poll from the past month, the analysis gives Obama an 81% probability of taking the state.

Romney is up by +3% in one poll and down by -1% in another in New Hampshire. Combined with one other current poll Obama gets a 63% probability of winning now.

The other bit of good news for Romney is the most recent North Carolina poll that has Romney leading Obama by a modest +6%. Romney now leads in five of eight current polls and must be considered the leader in the state. A turn-around for Romney can be discerned from the last 6 months of polling:

ObamaRomney20Aug12-20Sep12North Carolina

There are three new Ohio polls, but I accidentally left the new FOX News poll out for this analysis. Even without that +7% for Obama, the two new polls give Obama a slight lead. Romney has only led in one of the seven current polls, and Obama would be expected to win the state now with a 90% probability. (The FOX News poll will be in the next analysis.)

We finally get a new poll in Oregon, and Obama is still up by something over 8%.

Pennsylvania is still looking blue. The past past month of polling has Obama winning an election now with certainty.

Six new polls in Virginia all go pretty convincingly for Obama. The polling history over six months completes the story…whatever advantage Romney had in the state a few weeks ago was transient:
ObamaRomney20Aug12-20Sep12Virginia

It doesn’t look like Ryan will be delivering Wisconsin to Romney. The four new polls range from +3% to +14% for Obama. If anything, the selection of Ryan has moved the state further into Obama’s column:

ObamaRomney20Aug12-20Sep12Wisconsin

Now, after a Monte Carlo analysis employing 100,000 simulated elections, Obama wins 99,975 times and Romney wins 25 times. Obama receives (on average) 336 to Romney’s 202 electoral votes. The analysis suggests that, in an election right now, Obama would have very nearly a 100.0% probability of defeating Romney.

The long term trends in this race can be seen from a series of elections simulated every seven days using polls from 20 Sep 2011 to 20 Sep 2012, and including polls from the preceding month (FAQ). Obama is performing near his peak for the election season.

Electoral College Map

Alabama Alaska Arizona Arkansas California Colorado Connecticut Delaware Florida Georgia Hawaii Idaho Illinois Indiana Iowa Kansas Kentucky Lousiana Maine Maryland Massachusettes Michigan Minnesota Mississippi Missouri Montana Nebraska Nevada New Hampshire New Jersey New Mexico New York North Carolina North Dakota Ohio Oklahoma Oregon Pennsylvania Rhode Island South Carolina South Dakota Tennessee Texas Utah Vermont Virginia D.C. Washington West Virginia Wisconsin Wyoming

Electoral College Map

Georgia Alaska Arizona Arkansas California Colorado Delaware Connecticut Florida Mississippi Alabama Hawaii Idaho Illinois Indiana Iowa Kansas Kentucky Louisiana Maine Maryland Massachusetts Michigan Minnesota Missouri Montana Nebraska Nevada New Hampshire New Jersey New Mexico New York North Carolina North Dakota Ohio Oklahoma Oregon Pennsylvania Rhode Island South Carolina South Dakota Tennessee Texas Utah Vermont Virginia D.C. Washington West Virginia Wisconsin Wyoming

Here is the distribution of electoral votes [FAQ] from the simulations:
[Read more…]

157 Stoopid Comments

Friday Night Multimedia Extravaganza!

by Darryl — Saturday, 9/15/12, 12:06 am

Thom: Why the G.O.P. doesn’t want the Fed to help.

Liberal Viewer: FAUX News bias in editing Warren video.

Ed and Pap: Cheney’s incompetence killed 3,000 Americans.

Ellen makes ‘nice’ political ads for Mitt Romney and Barack Obama.

Sam Seder: Rand Paul is SCHOOLED on government jobs under Obama.

Bill Maher: It’s a Significantly Less Wonderful Life.

Let’s talk about values.

Daily Show: How to spin doctor a story.

Thom: The Good, the Bad, and the Very, Very Ugly.

Buzz60: Sheriff Joe Arpaio and Pat Boone indicate that the Birfer movement is over.

Young Turks: Snoop Dog, “Bush Fucked up for 8 years, vote Obama.

Jonathan Mann: Bearhug the President.

Sam Seder and Glenn Greenwald: Getting away with torture.

Greenman: An interview with Mauri Pelto about retreating glaciers in the Pacific Northwest:

Lawrence O’Donnell: NBC battleground poll shows big leads for President Obama.

Chris Mathews plays FDR clip that perfectly describes Republicans.

Willard!

  • Ann Telnaes: Romney tries another strategy to get a bounce in the polls
  • Slate TV: Democrats turn Tables and question Romney’s national security competence.
  • Top five reasons why Mitt won’t release his tax returns.
  • Tagg and Craig with Romney Rock!
  • Buzz60: Swing states are swinging to Obama.
  • Slate TV: Romney spoiler—Libertarian Party nominee Gary Johnson on ballot in 47 states.
  • Thom and Pap: Media ignores Romney lies in favor of politicization
  • Maddow: War on Women in VA could cost Romney the race.
  • Young Turks: Conservatives defending Romney’s erroneous statement on Libya.
  • Zina Saunders: The Romney Identi-Kit.
  • Young Turks: Romney’s “embassy” comments backfire.
  • The Cheeters.
  • The three branches of Mitt Romney’s ‘Neo-CON’ foreign policy
  • Slate TV: Romney’s attack backfires.
  • Sharpton: Romney campaign hands out ‘Talking Points’ on Libya
  • Maddow: Ryan shares billing with “former Terrorist” at fringe conference.
  • Buzz60: Kanye West new song takes on Mitt Romney’s taxes.
  • Thom: Romney finds a new way to lie.
  • Slate TV: Kanye West, “Mitt Romney Don’t Pay No Tax”
  • Ann Telnaes: Mittstep.

Maddow: Judge says Walker’s union-stripping law is unconstitution.

Young Turks: Bachmann or Palin…who’s CRAZIER???

Thom: The Good, The Bad, and The Very, Very Ugly.

“Obama Style”: a hit video that simply destroys Obama.

Sam Seder: Bush’s 9/11 fail is far worse than you thought!

G.O.P. Voter Suppression Efforts

  • Pap and Thom: G.O.P. steps up voter suppression efforts.
  • Sam Seder: G.O.P. makes it difficult to register in Florida.
  • Thom: Voter ID goes to PA Supreme Court.
  • Maddow: Exposing the G.O.P. voter suppression effort.

White House: West Wing Week.

Kimmel: This week in unnecessary censorship.

Young Turks: Poll shows some Republicans think Mitt Romney killed bin Laden.

Liberal Viewer: FAUX News suggests Obama hates God.

Thom: more Good, Bad and Very, Very Ugly.

Last week’s Friday Night Multimedia Extravaganza can be found here.

243 Stoopid Comments

Poll Analysis: The post-convention story

by Darryl — Thursday, 9/13/12, 10:13 pm


Obama Romney
97.9% probability of winning 2.1% probability of winning
Mean of 306 electoral votes Mean of 232 electoral votes

Now that both conventions have come and gone and the post-convention polls are coming out, it’s a good time to assess the “score” in the 2012 Presidential Election.

My previous Monte Carlo analysis of the race was posted ten days ago (between the two conventions) and showed President Barack Obama leading Governor Mitt Romney by a mean of 305 to 233 electoral votes. An election held then would be expected to end in Obama’s favor with a 97.2% probability. Romney had a 2.8% probability of winning.

Thirty two new state head-to-head polls covering 18 states have been released since then:

start end sample % % %
st poll date date size MOE O R diff
AZ PPP 07-Sep 09-Sep 993 3.1 44 53 R+9
CA SurveyUSA 09-Sep 11-Sep 524 4.3 57.4 34.9 O+22.5
CO Keating 10-Sep 11-Sep 503 4.4 49 44 O+5
CO PPP 31-Aug 02-Sep 1001 3.1 49 46 O+3
FL Rasmussen 12-Sep 12-Sep 500 4.5 48 46 O+2
FL Marist 09-Sep 11-Sep 980 3.1 49 44 O+5
FL Mclaughlin & Assoc 09-Sep 10-Sep 600 4.0 47 50 R+3
FL SurveyUSA 07-Sep 09-Sep 596 4.1 48.2 44.5 O+3.7
FL Gravis Marketing 02-Sep 02-Sep 1288 2.7 46.7 48.0 R+1.3
IL WeAskAmerica 05-Sep 05-Sep 1382 2.8 54 37 O+17
MI EPIC/MRA 08-Sep 11-Sep 600 4.5 47 37 O+10
MI PPP 31-Aug 02-Sep 1001 3.4 51 44 O+7
MN PPP 10-Sep 11-Sep 824 3.4 51 44 O+7
MN SurveyUSA 06-Sep 09-Sep 551 4.3 49.6 40.4 O+9.3
MO Rasmussen 11-Sep 11-Sep 500 4.5 45 48 R+3
MT PPP 10-Sep 11-Sep 656 3.8 45 50 R+5
NH U NH 04-Sep 10-Sep 592 4.0 45 40 O+5
NJ Quinnipiac 27-Aug 02-Sep 1471 2.6 51 44 O+7
NM PPP 07-Sep 09-Sep 1122 2.9 53 42 O+11
NM Research & Polling 03-Sep 06-Sep 667 3.8 45 40 O+5
NY Quinnipiac 04-Sep 09-Sep 1486 2.5 62 34 O+28
NC PPP 07-Sep 09-Sep 1087 3.0 49 48 O+1
NC SurveyUSA 04-Sep 06-Sep 500 4.5 43 53 R+10
OH Rasmussen 12-Sep 12-Sep 500 4.5 47 46 O+1
OH PPP 07-Sep 09-Sep 1072 3.0 50 45 O+5
OH Gravis Marketing 07-Sep 08-Sep 1548 2.7 47.3 43.2 O+4.1
OH Gravis Marketing 02-Sep 02-Sep 1381 2.9 43.7 46.8 R+3.1
TX WPA 09-Sep 11-Sep 1000 3.1 40 55 R+15
VA Marist 09-Sep 11-Sep 996 3.1 49 44 O+5
VA Gravis Marketing 08-Sep 09-Sep 2238 2.2 44.0 49.4 R+5.4
WA PPP 07-Sep 09-Sep 563 — 53 42 O+11
WA SurveyUSA 07-Sep 09-Sep 524 4.4 54.4 37.6 O+16.8

I’ll only discuss a few states.

In Colorado, Obama takes both new polls, but by modest margins. Colorado seems to have settled for Obama by a small margin:
ObamaRomney13Aug12-13Sep12Colorado

Five new polls from Florida ought to be enough to tell us who’s ahead. But, no: Obama takes three and Romney takes two. This gives us a total of 12 “current polls” (i.e. those taken in the past month), and in aggregate, Romney comes up with an advantage. In an election now, Romney would take Florida with about an 80% probability.

Obama takes both new Michigan polls by fairly nice margins. There are a total of seven “current polls” for the state—all but two go to Obama—and Obama won 94% of the simulated elections in the state.

Obama seems to have Minnesota pretty well locked up, with the new polls.

The new Missouri poll give Romney a small +3% lead over Obama. We have four other “current” Missouri polls from August. Romney takes all but one. Unless there is some kind of post convention second thoughts coming from the state’s voters, Romney looks likely to win the state.

Romney takes the latest Montana poll by just +5%. The previous poll, from mid-August had Romney up by +17%.

Obama turns in a weak +5% performance In New Hampshire, suggesting he only has an 81% chance of taking the state now.

In New Mexico, Obama is as strong as anywhere. The two new poll have him at +11% and +5%. The older current poll from mid-August is a +14%.

Two new North Carolina polls offer dissimilar pictures. The PPP poll offers Obama a +1% edge over Romney, but the Survey USA poll done for the Civitas Institute (a very right-wing state “think tank”) has Romney up by +10%. The Survey USA poll was taken during the convention and the PPP poll was taken after, so one could argue that there is a post-convention bounce for Obama. But the evidence to support that is vanishingly thin. The polling for the past month gives one poll to Obama, two ties, and four to Romney. Overall, the evidence still supports a good Romney advantage in the state. Here is all the polling in a nicepicture:

ObamaRomney13Aug12-13Sep12North Carolina

Four new Ohio polls split three to one for Obama. The three Obama polls are all post-convention. Romney’s poll is pre-convention. The nine polls taken over the past month go five for Obama, two for Romney and two ties. The evidence gives Obama a slightly stronger advantage in Ohio than Romney has in North Carolina.

The Virginia split, giving Obama a +5% in one and Romney a +5.4% in an even larger poll. The other three current polls go one for Obama, one for Romney and one tie. The state is still really, really, close, although Romney wins about 68% of the simulated elections.

Two Washington polls offer no surprises: Obama dominates with a double-digit lead. End of story.

With all those new polls, a Monte Carlo analysis of 100,000 simulated elections, gives Obama 97,854 wins and Romney 2,146 wins (including the 239 ties). Obama receives (on average) 306 (+1) to Romney’s 232 (-1) electoral votes. These results suggest that, for an election held now, Obama would have a 97.9% (+0.5%) probability of winning and Romney, a 2.1% (-0.5%) probability of winning.

In other words, little has changed in the past ten days. Obama still maintains a solid lead in the electoral college vote. It is interesting to note that the popular vote (as assessed by national polls) seems to be swinging in Obama’s direction now as well.

The long term trends in this race can be seen from a series of elections simulated every seven days using polls from 13 Sep 2011 to 13 Sep 2012, and including a one month polling window (FAQ).

Compared to 2008, this is not a very dynamic race.

Electoral College Map

Alabama Alaska Arizona Arkansas California Colorado Connecticut Delaware Florida Georgia Hawaii Idaho Illinois Indiana Iowa Kansas Kentucky Lousiana Maine Maryland Massachusettes Michigan Minnesota Mississippi Missouri Montana Nebraska Nevada New Hampshire New Jersey New Mexico New York North Carolina North Dakota Ohio Oklahoma Oregon Pennsylvania Rhode Island South Carolina South Dakota Tennessee Texas Utah Vermont Virginia D.C. Washington West Virginia Wisconsin Wyoming

Electoral College Map

Georgia Alaska Arizona Arkansas California Colorado Delaware Connecticut Florida Mississippi Alabama Hawaii Idaho Illinois Indiana Iowa Kansas Kentucky Louisiana Maine Maryland Massachusetts Michigan Minnesota Missouri Montana Nebraska Nevada New Hampshire New Jersey New Mexico New York North Carolina North Dakota Ohio Oklahoma Oregon Pennsylvania Rhode Island South Carolina South Dakota Tennessee Texas Utah Vermont Virginia D.C. Washington West Virginia Wisconsin Wyoming

Here is the distribution of electoral votes [FAQ] from the simulations:
[Read more…]

116 Stoopid Comments

Drinking Liberally—Seattle

by Darryl — Tuesday, 9/11/12, 3:50 pm

Please join us tonight for an evening of politics and conversation over a pint at the Seattle Chapter of Drinking Liberally.

We meet every Tuesday at the Montlake Ale House, 2307 24th Avenue E. Starting time is 8:00pm. Some people show up earlier for Dinner.


Can’t make it to Seattle tonight? Check out one of the other DL meetings over the next week. Tonight the Tri-Cities and Vancouver, WA chapters meet, and Thursday night Drinking Liberally Bremerton meets.

With 227 chapters of Living Liberally, including thirteen in Washington state four in Oregon and three more in Idaho, chances are excellent there’s a chapter that meets near you.

350 Stoopid Comments

Michelle speaks

by Darryl — Tuesday, 9/4/12, 10:48 pm

165 Stoopid Comments

Poll Analysis: Romney slips a bit

by Darryl — Monday, 9/3/12, 6:01 pm


Obama Romney
97.2% probability of winning 2.8% probability of winning
Mean of 305 electoral votes Mean of 233 electoral votes

The previous analysis showed President Barack Obama leading Mitt Romney by 302 to 236 electoral votes. If the election was held then, Obama would be expected to win with a 96.9% probability, and Romney with a 3.1% probability.

Only seven new polls covering five states have been released since then. But, on the heels of the Republican convention and the start of the Democratic convention, this seems like a good place to take stock of the race. First, the new polls:

start end sample % % %
st poll date date size MOE O R diff
FL PPP 31-Aug 02-Sep 1548 2.5 48 47 O+1
MI EPIC/MRA 28-Aug 28-Aug 1200 2.6 49 46 O+3
MO PPP 28-Aug 29-Aug 621 3.9 41 53 R+12
NC PPP 31-Aug 02-Sep 1012 3.1 48 48 tie
NC SurveyUSA 26-Aug 30-Aug 543 4.3 43 46 R+3
NC Elon U 25-Aug 30-Aug 1089 3.0 43 47 R+4
WV R.L. Repass 22-Aug 25-Aug 401 4.9 38 52 R+14

Close as ever, the new Florida poll has Obama leading Romney by +1%. This poll has been taken as evidence for a lack of a strong convention (or Ryan) bump. But, who knows in Florida, the next poll may go strongly for Romney.

Michigan puts Obama over Romney by a rather weak +3%. The longer term trend suggests a much tighter race than earlier in the year. But Obama still seems to have the advantage:

ObamaRomney03Aug12-03Sep12Michigan

A surprise poll comes out of Missouri, where Romney leads Obama by +12%. This double digit lead is a wider gap than we have seen recently. But the real surprise is the increasing variability seen among pollsters. Just two polls ago, Rasmussen found Obama leading Romney by +1%:

ObamaRomney03Aug12-03Sep12Missouri

Three North Carolina polls mostly favor Romney. The two tie in the most recent poll. The two other polls give Romney a +3% and +4% advantage. With six “current” polls in the state, the weight of evidence is that Romney would win the state (now) with a 69% probability:

ObamaRomney03Aug12-03Sep12North Carolina

In West Virginia, Romney leads Obama by a +14%. Believe it or not, this race has tightened up since the last couple of polls.

Now, after 100,000 simulated elections, Obama wins 97,197 times and Romney wins 2,803 times (including the 330 ties). Obama receives (on average) 305 (+3) to Romney’s 233 (-3) electoral votes. Obama has a 97.2% (+0.3%) probability of winning and Romney has a 2.8% (-0.3%) probability of winning an election held now. The difference from the previous analysis is really too small to “make” anything over.

Now, let’s consider the longer term trends in this race. I’ve done as series of Monte Carlo analyses, conducted every seven days using all the polls from the last year. For each simulation, I follow the same rules of including only polls from the past month (and the most recent poll before then if there are none) (FAQ). The following graph shows how the election is “scored” over time. The middle (magenta) line is the median number of electoral votes for Obama. When that line dips below the dashed line, Romney wins. Above it, Obama wins.

The pair of tan lines show the interval of electoral college totals within which 75% of the results for Obama were found. And the outer green lines show the interval of electoral college totals within which 95% of the results for Obama were found.

Romney was at his best in the 4th quarter of 2011. Even then, his probability of winning the election was never greater than about 30%. Beginning in late January, Romney slipped into zero percent territory, and has been there until recently. He has now recovered to same place he was in late January.

The general election has just started, so we are at a point with much potential for big change in the standings. In 2008, we saw McCain begin to do, only to have Obama run away with it in the end.

Electoral College Map

Alabama Alaska Arizona Arkansas California Colorado Connecticut Delaware Florida Georgia Hawaii Idaho Illinois Indiana Iowa Kansas Kentucky Lousiana Maine Maryland Massachusettes Michigan Minnesota Mississippi Missouri Montana Nebraska Nevada New Hampshire New Jersey New Mexico New York North Carolina North Dakota Ohio Oklahoma Oregon Pennsylvania Rhode Island South Carolina South Dakota Tennessee Texas Utah Vermont Virginia D.C. Washington West Virginia Wisconsin Wyoming

Electoral College Map

Georgia Alaska Arizona Arkansas California Colorado Delaware Connecticut Florida Mississippi Alabama Hawaii Idaho Illinois Indiana Iowa Kansas Kentucky Louisiana Maine Maryland Massachusetts Michigan Minnesota Missouri Montana Nebraska Nevada New Hampshire New Jersey New Mexico New York North Carolina North Dakota Ohio Oklahoma Oregon Pennsylvania Rhode Island South Carolina South Dakota Tennessee Texas Utah Vermont Virginia D.C. Washington West Virginia Wisconsin Wyoming

[Read more…]

42 Stoopid Comments

Poll Analysis: Even more Ryan bump

by Darryl — Wednesday, 8/29/12, 4:00 pm


Obama Romney
96.9% probability of winning 3.1% probability of winning
Mean of 302 electoral votes Mean of 236 electoral votes

The previous analysis showed G.O.P. presidential candidate Mitt Romney edging up to almost a 1% probability of winning an election held now. Romney lagged in expected electoral votes to President Barack Obama by 230 to 308.

Since then, 15 new polls covering 12 states have been released.

start end sample % % %
st poll date date size MOE O R diff
CO Keating 21-Aug 22-Aug 500 4.4 48 44 O+4
CT Quinnipiac 22-Aug 26-Aug 1472 2.6 52 45 O+7
CT PPP 22-Aug 23-Aug 881 — 53 40 O+13
FL CNN/TIME 22-Aug 26-Aug 895 3.5 50 46 O+4
IA PPP 23-Aug 26-Aug 1244 2.8 47 45 O+2
MI Mitchell 23-Aug 23-Aug 1277 2.7 46.6 46.7 R+0.1
MO Mason-Dixon 22-Aug 23-Aug 625 4.0 43 50 R+7
MO Rasmussen 22-Aug 22-Aug 500 4.5 47 46 O+1
NV PPP 23-Aug 26-Aug 831 3.4 50 47 O+3
NJ Eagleton-Rutgers 23-Aug 25-Aug 710 3.5 51 37 O+14
NC CNN/Time 22-Aug 26-Aug 766 3.5 47 48 R+1
NC SurveyUSA 18-Aug 23-Aug 540 4.3 43 43 tie
OH Columbus Dispatch 15-Aug 25-Aug 1758 2.1 45 45 tie
PA Philadelphia Inquirer 21-Aug 23-Aug 601 4.0 51 42 O+9
VA Rasmussen 23-Aug 23-Aug 500 4.5 47 47 tie

Obama takes the latest Colorado poll by +4% over Romney, and he leads in four of the five current polls for the state.

Two polls in Connecticut both go to Obama. The Quinnipiac poll has Obama up by a modest +7%. A slightly older PPP poll has Obama up by +13%.

The latest Florida poll has Obama leading Romney by +4%. The current Florida polls go 4 to 2 for Romney, and Romney is given a 97% chance of winning the state right now.

Obama is up by +2% in the new Iowa poll. The candidates split the two current polls, but the poll that has Obama up is the much larger of the two: ObamaRomney29Jul12-29Aug12Iowa

In Michigan, Romney leads Obama by a weak +0.1%. The candidates split the four current polls, but the weight of the evidence has Obama up slightly with a 57% probability of winning an election held now.

The candidates split the two Missouri polls, with Romney up by +7% in one and Obama up by +1% in another. Obama has only led in this one poll out of the 6 current Missouri polls: ObamaRomney29Jul12-29Aug12Missouri

Nevada has Obama up by a slender +3% over Romney, slightly beating the +2% he had in the other current poll: ObamaRomney29Jul12-29Aug12Nevada

Little surprise that New Jersey has Obama up by a double-digit lead (+14%) over Romney.

In North Carolina, Romney has a +1% lead over Obama in one poll and the candidates are tied in another. The weight of evidence in the five current polls has Romney up by the slightest margin and a 56% probability of taking the state in an election held now:
ObamaRomney29Jul12-29Aug12North Carolina

Ohio is a tie at 45% each in the new poll. But Obama has led in three of the current six polls (with two ties), so the weight of evidence gives him an 87% probability of taking the state right now:
ObamaRomney29Jul12-29Aug12Ohio

Another Pennsylvania poll gives Obama a +9% lead over Romney. Obama take all three of the current polls and would be expected to win an election now with a 99% probability.

Virginia is all tied up at 47% in the newest poll. Overall, Obama takes 4 of the six current polls, so he ends up with a 90% probability of winning an election held now.

Now, after 100,000 simulated elections, Obama wins 96,863 times and Romney wins 3,137 times (including the 449 ties). Obama receives (on average) 302 (-6) to Romney’s 236 (+6) electoral votes. In an election held now, we would expect Obama to win with a 96.9% (-2.3%) probability and Romney with a 3.1% (+2.3%) probability.

Electoral College Map

Alabama Alaska Arizona Arkansas California Colorado Connecticut Delaware Florida Georgia Hawaii Idaho Illinois Indiana Iowa Kansas Kentucky Lousiana Maine Maryland Massachusettes Michigan Minnesota Mississippi Missouri Montana Nebraska Nevada New Hampshire New Jersey New Mexico New York North Carolina North Dakota Ohio Oklahoma Oregon Pennsylvania Rhode Island South Carolina South Dakota Tennessee Texas Utah Vermont Virginia D.C. Washington West Virginia Wisconsin Wyoming

Electoral College Map

Georgia Alaska Arizona Arkansas California Colorado Delaware Connecticut Florida Mississippi Alabama Hawaii Idaho Illinois Indiana Iowa Kansas Kentucky Louisiana Maine Maryland Massachusetts Michigan Minnesota Missouri Montana Nebraska Nevada New Hampshire New Jersey New Mexico New York North Carolina North Dakota Ohio Oklahoma Oregon Pennsylvania Rhode Island South Carolina South Dakota Tennessee Texas Utah Vermont Virginia D.C. Washington West Virginia Wisconsin Wyoming

[Read more…]

32 Stoopid Comments

Poll Analysis: More Ryan bump

by Darryl — Thursday, 8/23/12, 1:42 pm


Obama Romney
99.2% probability of winning 0.8% probability of winning
Mean of 308 electoral votes Mean of 230 electoral votes

The previous analysis showed President Barack Obama leading Mitt Romney by a mean of 325 to 213 electoral votes. In an election held then, we would have expected Obama to win with a 99.8% and Romney with a 0.2% probability.

In the last two days there have been a plethora of polls released—16 covering 13 states. Here’s what I’ve found:

start end sample % % %
st poll date date size MOE O R diff
CT Rasmussen 21-Aug 21-Aug 500 4.5 51 43 O+8
FL Quinnipiac 15-Aug 21-Aug 1241 3.0 49 46 O+3
FL Foster McCollum White 17-Aug 17-Aug 1503 2.5 39.1 53.3 R+14.3
GA 20/20 Insight 15-Aug 18-Aug 1158 2.9 44 47 R+3
MA PPP 16-Aug 19-Aug 1115 2.9 55 39 O+16
MI Glengariff Group 18-Aug 20-Aug 600 4.0 47.5 42.0 O+5.5
MO PPP 20-Aug 20-Aug 500 4.4 42 52 R+10
MT Rasmussen 20-Aug 20-Aug 500 4.5 38 55 R+17
NV SurveyUSA 16-Aug 21-Aug 869 3.4 47 45 O+2
NM Rasmussen 21-Aug 21-Aug 500 4.5 52 38 O+14
OH Ohio Poll 16-Aug 21-Aug 847 3.4 49 46 O+3
OH Quinnipiac 15-Aug 21-Aug 1253 3.0 50 44 O+6
PA Muhlenberg 20-Aug 22-Aug 422 5.0 49 40 O+9
VT Castleton Poll 11-Aug 21-Aug 477 — 62 25 O+37
WI Quinnipiac 15-Aug 21-Aug 1190 3.0 49 47 O+2
WI Marquette 16-Aug 19-Aug 576 4.2 49.8 44.3 O+5.5

The unsurprising Obama polls are from Vermont, Massachusetts, and Connecticut. Likewise, Romney makes a strong showing in Montana and Missouri.

Romney makes a surprisingly weak +3% showing in Georgia, where he has been typically been doing high single digit or double digit leads.

There is a big surprise in Florida. A Quinnipiac poll gives Obama a +3% edge over Romney. That’s not the surprise. A second poll by Foster McCollum White has Romney up by an amazing (unbelievable?) +14%. This poll requires some discussion.

This poll has triggered a lot of chatter among poll collectors. Is it real? Is it honest? Is it an “outlier.” One of the thing I noticed is that the raw tallies in the poll add up to more than 100%—102.13%, to be exact!

I went to the source; I had a chat with the firm’s pollster Eric Foster. Eric was friendly and most helpful. The poll is not sponsored by anyone. Rather, they firm did the poll on their own, as a way to get their feet wet in Florida (so to speak). It is an independent poll. I asked about the percentages summing to greater than 100%, he suggested this is a result of their weighting. I proposed renormalizing the numbers to proportionately reduce them to 100%, and he agreed this was a good strategy.

We then had a discussion about their weighting method. They went to each county to get voter turn-out information by age group and race/ethnicity and used that to weigh the poll (some of the details were lost in our lousy cell phone to cell phone connection). He stands by the numbers.

In other words, a polling firm that is new to Florida used an elaborate and unorthodox turnout model to weight the poll, and ended up with some kind of error that resulted in percentages totaling greater than 100%. I cannot say that I am convinced that what they have done was done correctly. Even so, it meets my poll criteria and it could be correct. (They’ll look like geniuses if Florida goes double digits for Romney!) So I include it here, and recognize that Florida will be reddish for the next month. But Georgia is not quite red enough and we still need a new poll in South Carolina! That’s the way the polls roll.

Earlier this week two polls in Michigan split between the candidates. The new poll swings back in Obama’s favor (+5.5%).

Nevada has Obama up by a fragile +2%, but Obama has maintained the edge since the start of the year:

ObamaRomney23Jul12-23Aug12Nevada

New Mexico loves Obama, giving him a +14% lead over Romney this poll.

Two new Ohio polls both go for Obama by +3% and +6%. Likewise, Pennsylvania seems to prefer Obama over Romney by +9%.

Finally, Ryan may have had a small effect on Wisconsin, where Obama scored a +2% in one poll and +5.5% in another. The race has certainly tightened but a lasting effect is not obvious based on these newest polls:
ObamaRomney23Jul12-23Aug12Wisconsin

Today, after 100,000 simulated elections, Obama wins 99,173 times and Romney wins 827 times (including the 175 ties). Obama receives (on average) 308 (-17) to Romney’s 230 (+17) electoral votes. In an election held now, Obama would be expected to win with a 99.2% (-0.6%) probability; Romney would have about a 0.8% (+0.6%) probability of winning.

Electoral College Map

Alabama Alaska Arizona Arkansas California Colorado Connecticut Delaware Florida Georgia Hawaii Idaho Illinois Indiana Iowa Kansas Kentucky Lousiana Maine Maryland Massachusettes Michigan Minnesota Mississippi Missouri Montana Nebraska Nevada New Hampshire New Jersey New Mexico New York North Carolina North Dakota Ohio Oklahoma Oregon Pennsylvania Rhode Island South Carolina South Dakota Tennessee Texas Utah Vermont Virginia D.C. Washington West Virginia Wisconsin Wyoming

Electoral College Map

Georgia Alaska Arizona Arkansas California Colorado Delaware Connecticut Florida Mississippi Alabama Hawaii Idaho Illinois Indiana Iowa Kansas Kentucky Louisiana Maine Maryland Massachusetts Michigan Minnesota Missouri Montana Nebraska Nevada New Hampshire New Jersey New Mexico New York North Carolina North Dakota Ohio Oklahoma Oregon Pennsylvania Rhode Island South Carolina South Dakota Tennessee Texas Utah Vermont Virginia D.C. Washington West Virginia Wisconsin Wyoming

[Read more…]

55 Stoopid Comments

Poll Analysis: The Ryan Bump!

by Darryl — Tuesday, 8/21/12, 4:32 pm


Obama Romney
99.8% probability of winning 0.2% probability of winning
Mean of 325 electoral votes Mean of 213 electoral votes

It’s been ten days since Mitt Romney announced his running mate. Polling has been a little on the slow side since then, but we now have 15 new polls in nine states to throw into the mix. Most of the polls have been taken since the August 11 announcement.

The previous analysis showed President Barack Obama leading Romney by a mean of 334 electoral votes to Romney’s mean of 204 electoral votes. An election held then was nearly 100% certain to go to Obama.

Here are the new polls:

start end sample % % %
st poll date date size MOE O R diff
CO Purple Poll 13-Aug 14-Aug 600 4.0 49 46 O+3
FL Gravis Marketing 20-Aug 20-Aug 728 3.8 45.1 48.3 R+3.2
FL Rasmussen 15-Aug 15-Aug 500 4.5 43 45 R+2
FL Purple Poll 13-Aug 14-Aug 600 4.0 47 48 R+1
MI Baydoun 16-Aug 16-Aug 1733 2.3 43.9 47.7 R+3.8
MI Mitchell 13-Aug 13-Aug 1079 3.0 49 44 O+5
MO Chilenski Strategies 08-Aug 08-Aug 663 3.8 47 48 R+1
NY Siena 14-Aug 19-Aug 671 3.8 62 33 O+29
OH Purple Poll 13-Aug 14-Aug 600 4.0 44 46 R+2
OK SoonerPoll 26-Jul 14-Aug 495 — 29 58 R+29
VA PPP 16-Aug 19-Aug 855 3.4 50 45 O+5
VA Purple Poll 13-Aug 14-Aug 600 4.0 45 48 R+3
WI PPP 16-Aug 19-Aug 1308 2.7 47 48 R+1
WI Rasmussen 15-Aug 15-Aug 500 4.5 47 48 R+1
WI CNN/Opinion Research 13-Aug 14-Aug 920 3.0 49 45 O+4

Colorado gives Obama a +3% lead, and a winning streak of three August polls.

Romney takes all three Florida polls, matching Obama’s streak of three from the previous round. Overall, the past month of polls favor Obama with a 68% probability of winning the state. Of course, the pre-Ryan polls likely overestimate Obama’s chances.

Michigan puts Romney over Obama by a delicate +3.8% in one poll and Obama over Romney by 5% in another. The six current polls suggest Obama would win with a 90% probability right now.

The Missouri poll is pre-Ryan, and shows Romney with a slender +1% lead. In fact, a newer SurveyUSA poll that I mentioned in the previous analysis had Romney leading by slightly more (+1.9%).

No sign of a Ryan bump in New York, where Obama leads by +29%

We only have one new Ohio poll and that goes to Romney by +2%. The six current Ohio polls, taken together, give Obama a 98% probability of winning an election held now.

Oklahoma gives Obama a little bump. Romney’s +29% in the current poll was a +35% in May, when the last Sooner Poll was taken.

In Virginia, Obama leads Romney by +5% in one poll and Romney leads Obama by +3% in another. Obama leads in four of the five current polls and would be expected to win now with a 91% probability.

Will Ryan convince Wisconsin voters to support Romny? Three polls address this: Romney is up by a slim +1% in two polls and Obama is up by 4% in the third. Overall, Obama still wins the state by 97%.

A Monte Carlo analysis using 100,000 simulated elections finds Obama winning 99,771 times and Romney winning 229 times (including the 16 ties). Obama receives (on average) 325 (-9) to Romney’s 213 (+9) electoral votes. The results suggests that Obama would win and election held now with a 99.8% (-0.2%) probability and Romney would win with a 0.2% probability.

Empirically, the selection of a running mate tens to strengthen a candidate’s chances. Usually the bump are transient—that is, VP selection results in a temporary “bounce.” Here what we see is a small bump up some ten days after the announcement.

Since the analysis also includes numerous polls taken prior to the Ryan selection, we should expect Romney’s prospects to improve as the pre-Ryan polls “age out” of the analysis. Whether the bump persists or becomes a bounce is still unclear.

Electoral College Map

Alabama Alaska Arizona Arkansas California Colorado Connecticut Delaware Florida Georgia Hawaii Idaho Illinois Indiana Iowa Kansas Kentucky Lousiana Maine Maryland Massachusettes Michigan Minnesota Mississippi Missouri Montana Nebraska Nevada New Hampshire New Jersey New Mexico New York North Carolina North Dakota Ohio Oklahoma Oregon Pennsylvania Rhode Island South Carolina South Dakota Tennessee Texas Utah Vermont Virginia D.C. Washington West Virginia Wisconsin Wyoming

Electoral College Map

Georgia Alaska Arizona Arkansas California Colorado Delaware Connecticut Florida Mississippi Alabama Hawaii Idaho Illinois Indiana Iowa Kansas Kentucky Louisiana Maine Maryland Massachusetts Michigan Minnesota Missouri Montana Nebraska Nevada New Hampshire New Jersey New Mexico New York North Carolina North Dakota Ohio Oklahoma Oregon Pennsylvania Rhode Island South Carolina South Dakota Tennessee Texas Utah Vermont Virginia D.C. Washington West Virginia Wisconsin Wyoming

Here is the distribution of electoral votes [FAQ] from the simulations:
[Read more…]

142 Stoopid Comments

Libertarians sue to keep Mitt Romney off Washington ballot

by Darryl — Thursday, 8/16/12, 5:18 pm

The Libertarian Party of Washington State is suing to keep Mitt Romney off the ballot.

Their argument may be familiar to you…I wrote about it recently. By law, the Washington State Republican Party is a minor party and it hasn’t met the signature gathering requirements of a minor party for the fall Presidential election.

You can read the Libertarian’s complaint here. But let me briefly recap the argument.

In 2010, the WSRP didn’t nominate, or even endorse, anyone in the only statewide election. The reason, as I mentioned earlier, was that the Teabaggers were going to raise holy hell if Dino Rossi (who entered the race very late) got the nomination over uber-teabagger Clint Diddier for the U.S. Senate race.

Dino Rossi won a spot on the general election ballot by placing second in the primary. But, prior legal precedent has firmly established that our top-two primary is a “‘winnowing’ election designed to send only two candidates on to the general election without regard to political party nomination or affiliation,” rather than a nominating election.

So the Republicans failed to have a party nominee receive at least 5% of the vote in a 2010 statewide election as per RCW 29A.04.086:

“Major political party” means a political party of which at least one nominee for president, vice president, United States senator, or a statewide office received at least five percent of the total vote cast at the last preceding state general election in an even-numbered year.

They also failed to file the 1,000 signatures this year as is required for a minor party by RCW 29A.20.111 et seq.

Thus the Libertarians point out in their complaint:

Accordingly, the Washington State Republican Party is not entitled under the R.C.W. to have its nominee’s name printed on the November general election ballot, although its candidate (presumably Mr. Romney) is entitled to run as a write-in candidate.

In other words, the Libertarians (who are currently a minor party) want fair and equal treatment with the Republicans who, evidence suggests, is now a minor party.

And they have a point! It is how the law is written. And if the law is followed as written, there should be no Republican presidential ticket on our ballots this fall.

Here’s the thing. The relevant RCW actually predate the top-two primary. And, from one perspective, the major/minor party status law doesn’t quite jibe with a top-two primary system. In fact, in 2009, the SOS office pushed legislation that would have changed the major/minor party part of the law to better reflect a top-two primary. Alas, the bill (SB 5681) failed.

After my last post on this topic, I emailed the Secretary of State office to ask for their take on this issue. Dave Ammons respond with a helpful summary of the SOS position:

The Legislature has not repealed the old RCWs that were put in place for the old pick-a-party primary system, so many of the old definitions are still on the books. All three levels of federal courts (District Court, Ninth Circuit Court of Appeals, and U.S. Supreme Court) have commented at some point in the 8 year litigation over the Top Two Primary system that Initiative 872 impliedly repealed the old party nomination procedures for the pick-a-party primary. The upshot is that we have adapted many procedures for the Top Two Primary in WAC.

WAC 434-208-130 define major and minor political parties. The relevant paragraphs of the WAC state:

(1) For purposes of RCW 29A.04.086, “major political party” means a political party whose nominees for president and vice-president received at least five percent of the total votes cast for that office at the last preceding presidential election. A political party that qualifies as a major political party retains such status until the next presidential election at which the presidential and vice-presidential nominees of that party do not receive at least five percent of the votes cast.

In other words, the SOS office is relying on a WAC that changes the RCW, under the argument that the RCW’s major/minor party definitions were implicitly “repealed” when the pick-a-party procedures were replaced for the top-two primary.

The argument might make sense, except for two things. First, the major/minor party definitions as they exist under RCW are a little awkward to deal with, but they are certainly not incompatible with a system that primarily has top two primaries (except for presidential elections). Therefore, an argument can (and will!) be made that the definitions were not implicitly repealed as suggested by the SOS office. And you cannot use the WAC to “override” the RCW.

The second point is that the legislature actually considered the issue in SB 5681. They had a chance to change the law to dovetail with the definitions in the WAC. And they declined to do so!

It is a fascinating problem! That said, I don’t relish the idea of Mitt Romney being kept off the ballot.

What I enjoy about this predicament is just how fucked up the Teabaggers have made things for the WSRP. In almost any other year, the Republicans would have had the clone-like unity to rally behind the “chosen” candidate. They would have proudly nominated him and, knowingly or not, maintained their legal eligibility as a major party under all definitions. But not in 2010.

This is why I always keep a good stock of popcorn in my pantry….

Update (11:45 pm): I modified the post to remove an extraneous quote that was accidentally left in the original. I clarified the language in a couple of spots, too.

16 Stoopid Comments

  • « Previous Page
  • 1
  • …
  • 30
  • 31
  • 32
  • 33
  • 34
  • …
  • 96
  • Next Page »

Recent HA Brilliance…

  • Wednesday Open Thread Wednesday, 10/15/25
  • Drinking Liberally — Seattle Tuesday, 10/14/25
  • Monday Open Thread Monday, 10/13/25
  • Friday Night Multimedia Extravaganza! Friday, 10/10/25
  • Friday Open Thread Friday, 10/10/25
  • Was This What the Righties Wanted All Along? Thursday, 10/9/25
  • Wednesday Open Thread Wednesday, 10/8/25
  • Drinking Liberally — Seattle Tuesday, 10/7/25
  • Monday Open Thread Monday, 10/6/25
  • Friday Night Multimedia Extravaganza! Friday, 10/3/25

Tweets from @GoldyHA

I no longer use Twitter because, you know, Elon is a fascist. But I do post occasionally to BlueSky at @goldy.horsesass.org

From the Cesspool…

  • EvergreenRailfan on Wednesday Open Thread
  • Vicious Troll on Wednesday Open Thread
  • EvergreenRailfan on Wednesday Open Thread
  • Roger Rabbit on Wednesday Open Thread
  • Republicans the Party of Freeing the Slaves on Wednesday Open Thread
  • GrandOldPedophiles on Wednesday Open Thread
  • EvergreenRailfan on Wednesday Open Thread
  • Roger Rabbit on Wednesday Open Thread
  • Roger Rabbit on Wednesday Open Thread
  • Spend on the Credit Card GOP on Wednesday Open Thread

Please Donate

Currency:

Amount:

Archives

Can’t Bring Yourself to Type the Word “Ass”?

Eager to share our brilliant political commentary and blunt media criticism, but too genteel to link to horsesass.org? Well, good news, ladies: we also answer to HASeattle.com, because, you know, whatever. You're welcome!

Search HA

Follow Goldy

I no longer use Twitter or Facebook because Nazis. But until BlueSky is bought and enshittified, you can still follow me at @goldy.horsesass.org

HA Commenting Policy

It may be hard to believe from the vile nature of the threads, but yes, we have a commenting policy. Comments containing libel, copyright violations, spam, blatant sock puppetry, and deliberate off-topic trolling are all strictly prohibited, and may be deleted on an entirely arbitrary, sporadic, and selective basis. And repeat offenders may be banned! This is my blog. Life isn’t fair.

© 2004–2025, All rights reserved worldwide. Except for the comment threads. Because fuck those guys. So there.