Today’s R-71 data have been release by the Secretary of State’s office.
The total signatures examined has reached 88,191, which is 64.1% of the total petition. To date there have been 10,510 invalid signatures found, for an apparent rejection rate of 11.92%. This rate underestimates the rejection rate for the entire petition because it doesn’t account for the increasing rate of duplicates found as more signatures are examined.
The invalid signatures include 8,822 that were not found in the voting rolls, 867 duplicate signatures, and 821 that did not match the signature on file. There are also 44 signatures “pending” that I’ve ignored. The 867 duplicate signatures found thus far, gives a projected total duplication rate of about 1.90% for the petition.
Using the V2 estimator, the number of valid signatures on the petition is projected to be 120,519 leaving a shortfall of 58 signatures from the 120,577 needed to qualify for the ballot. This projection assumes that the signatures examined so far reflect a random sample of all signatures on the petition. As I discussed yesterday, this isn’t the case. In the last several days, there appear to be an unexplained, systematic increase in the rate at which signers are not found in the voting rolls.
If we correct the apparent rejection rate of 11.92% for duplicate signatures, the total rejection rate for the petition should be about 12.47%.
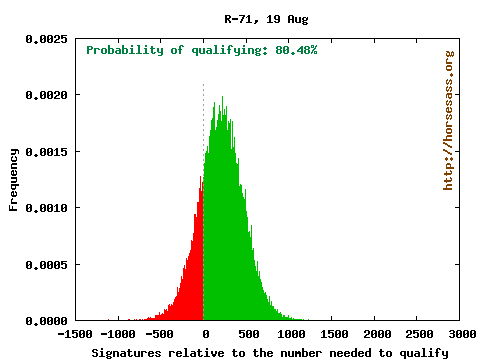
The extent of uncertainty in the outcome of R-71 can be seen from the results of a Monte Carlo analysis of 100,000 simulated petitions using the rates observed through today. The red bars show the mass of failed petitions and the green bars show the mass of petitions that made the ballot:
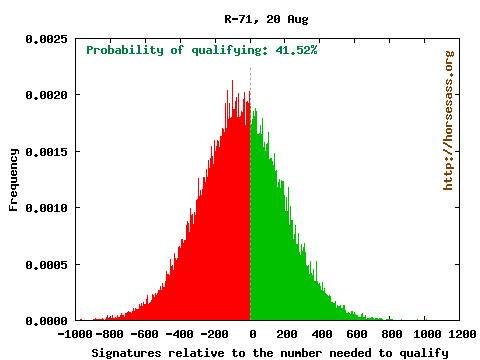
In the simulations, the petition qualified 41,520 times and failed 58,480 times, suggesting that, if today’s rates hold, R-71 would have a 41.52% chance of qualifying for the ballot. But, as we have seen for several days, the rejection rates aren’t holding—they have systematically increased.
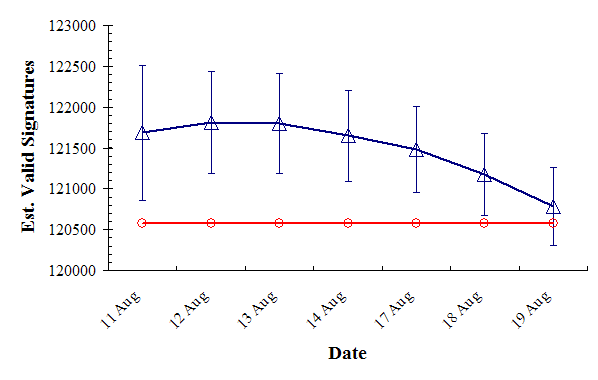
Finally, here is the big picture over the last couple of weeks. The blue symbols are projected median numbers of valid signatures for the petition and 95% confidence intervals. The red line is the number of signatures needed to qualify for the ballot.
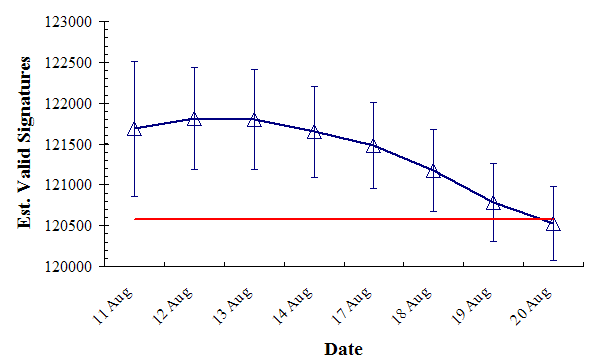
If the rejection rates were constant over time, the blue line would be mostly straight (bouncing around a little). What we actually see is a decline in the projected signatures suggesting the rejection rates are increasing.
Why are the error rates increasing with time? It is hard to know. Yesterday I mentioned the possibility that there could be temporal correlation, so that signatures collected later are being examined later. Dave Ammons (communications director for Secretary of State) suggests it isn’t so. I’m not completely convinced.
Whatever the reason, R-71 has now made the transition from qualifying to failing. Sure…it’s just barely failing, but should the rejection-rate trend continue, it will soon transition to a “safe fail”.
At least until the rate trends reverse….
Update: And then there is this. A substantial number of “not found” signatures are now being located in a more current voter roll. This third phase check has upped the uncertainty….