 |
 |
The previous analysis of the contest between former Vice President Joe Biden and President Donald Trump was just two days ago. There have been 73 new polls released since then. I usually expect polls to show a tightening race just before the election. Indeed, there are hints of this in the states you expect Trump to win, but show Biden the lead (like AZ, FL, and NC). Texas has tightened so that Trump now has only a very small lead. Iowa has also tightened, cutting into Biden’s lead, leaving a very close race. Regardless, there has been little overall change in the race.
In past analyses, I have been using polls taken in the past month as “current polls.” For today’s analysis, I have tightened up the “current poll” window because there are many polls being released and old polls may be less representative of the electorate. Now, the analyses consider only polls taken over the past three weeks as “current.” As it happens, the overall trends don’t change much by doing this, but Biden gets a “recent polls” bump out of this. The other way to think of it is this: Biden’s lead was being dragged down a bit by polls taken three to four weeks ago.
Today, after 100,000 simulated elections, Biden wins 100,000 times and Trump wins 0 times. Biden received (on average) 373 to Trump’s 165 electoral votes. In an election held now, Biden would have a greater than 99.9% probability of winning.
The long term trends in this race can be seen from a series of elections simulated every seven days using polls from 30 Oct 2019 to 30 Oct 2020, and including polls from the preceding 21 days (FAQ).

Here is the distribution of electoral votes [FAQ] from the simulations:
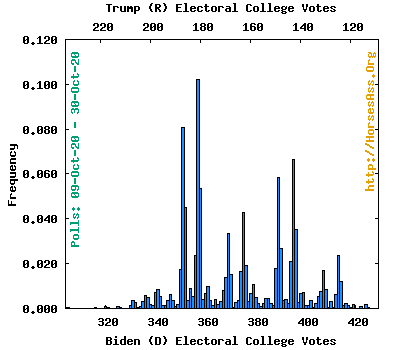
Ten most probable electoral vote outcomes for Biden (full distribution here):
- 357 electoral votes with a 10.19% probability
- 351 electoral votes with a 8.08% probability
- 395 electoral votes with a 6.65% probability
- 389 electoral votes with a 5.86% probability
- 358 electoral votes with a 5.36% probability
- 352 electoral votes with a 4.50% probability
- 375 electoral votes with a 4.30% probability
- 396 electoral votes with a 3.50% probability
- 369 electoral votes with a 3.33% probability
- 390 electoral votes with a 2.66% probability
The table shows the most likely outcome for Biden is 357 electoral votes (10% probability). In fact, 83% of the outcomes fall between 350 and 499. Biden wins in a 400+ EV landslide with a 10% probability. And the probability of Biden receiving under 350 EVs is only 7%.
After 100,000 simulations:
- Biden wins greater than 99.9%, Trump wins less than 0.1%.
- Average (SE) EC votes for Biden: 373.0 (21.5)
- Average (SE) EC votes for Trump: 165.0 (21.5)
- Median (95% CI) EC votes for Biden: 370 (337, 413)
- Median (95% CI) EC votes for Trump: 168 (125, 201)
Each column of this table shows the electoral vote total aggregated by different criteria for the probability of winning a state (Safe=100%, Strong=90%+, Leans=60%+, Weak=50%+):
| Threshold | Safe | + Strong | + Leans | + Weak |
|---|---|---|---|---|
| Safe Biden | 247 | |||
| Strong Biden | 103 | 350 | ||
| Leans Biden | 1 | 1 | 351 | |
| Weak Biden | 6 | 6 | 6 | 357 |
| Weak Trump | 38 | 38 | 38 | 181 |
| Leans Trump | 19 | 19 | 143 | |
| Strong Trump | 53 | 124 | ||
| Safe Trump | 71 |
This table summarizes results by state. Click on the poll count to see the individual polls included for the state.
| 1 | 1 | EC | # | Total | % | % | Biden | Trump | |
|---|---|---|---|---|---|---|---|---|---|
| 6 | 2 | Votes | polls | Votes | Biden | Trump | % wins | % wins | |
| AL | 9 | 2 | 1075 | 40.1 | 59.9 | 0.0 | 100.0 | ||
| AK | 3 | 2 | 1491 | 46.3 | 53.7 | 2.1 | 97.9 | ||
| AZ | 11 | 18 | 11842 | 51.2 | 48.8 | 96.3 | 3.7 | ||
| AR | 6 | 2 | 1165 | 34.8 | 65.2 | 0.0 | 100.0 | ||
| CA | 55 | 3 | 6695 | 67.9 | 32.1 | 100.0 | 0.0 | ||
| CO | 9 | 5 | 3413 | 57.0 | 43.0 | 100.0 | 0.0 | ||
| CT | 7 | 1 | 778 | 66.1 | 33.9 | 100.0 | 0.0 | ||
| DE | 3 | 1* | 737 | 62.0 | 38.0 | 100.0 | 0.0 | ||
| DC | 3 | 0* | (100) | (0) | |||||
| FL | 29 | 31 | 31128 | 51.5 | 48.5 | 99.9 | 0.1 | ||
| GA | 16 | 17 | 13126 | 51.0 | 49.0 | 93.9 | 6.1 | ||
| HI | 4 | 1* | 880 | 68.5 | 31.5 | 100.0 | 0.0 | ||
| ID | 4 | 1* | 565 | 36.6 | 63.4 | 0.0 | 100.0 | ||
| IL | 20 | 1 | 413 | 55.7 | 44.3 | 94.9 | 5.1 | ||
| IN | 11 | 3 | 1464 | 45.5 | 54.5 | 1.2 | 98.8 | ||
| IA | 6 | 9 | 5448 | 50.1 | 49.9 | 55.9 | 44.1 | ||
| KS | 6 | 3 | 3864 | 42.5 | 57.5 | 0.0 | 100.0 | ||
| KY | 8 | 2 | 821 | 41.5 | 58.5 | 0.1 | 99.9 | ||
| LA | 8 | 1 | 717 | 37.9 | 62.1 | 0.0 | 100.0 | ||
| ME | 2 | 2 | 1723 | 57.2 | 42.8 | 100.0 | 0.0 | ||
| ME1 | 1 | 2 | 850 | 62.6 | 37.4 | 100.0 | 0.0 | ||
| ME2 | 1 | 2 | 873 | 51.8 | 48.2 | 76.4 | 23.6 | ||
| MD | 10 | 1 | 746 | 63.8 | 36.2 | 100.0 | 0.0 | ||
| MA | 11 | 1 | 663 | 68.8 | 31.2 | 100.0 | 0.0 | ||
| MI | 16 | 28 | 23236 | 53.2 | 46.8 | 100.0 | 0.0 | ||
| MN | 10 | 8 | 5443 | 53.9 | 46.1 | 100.0 | 0.0 | ||
| MS | 6 | 1 | 487 | 42.7 | 57.3 | 1.1 | 98.9 | ||
| MO | 10 | 1 | 969 | 46.9 | 53.1 | 6.7 | 93.3 | ||
| MT | 3 | 6 | 4097 | 47.3 | 52.7 | 0.7 | 99.3 | ||
| NE | 2 | 0 | (0) | (100) | |||||
| NE1 | 1 | 1* | 376 | 48.9 | 51.1 | 39.1 | 60.9 | ||
| NE2 | 1 | 2* | 890 | 54.8 | 45.2 | 98.2 | 1.8 | ||
| NE3 | 1 | 0* | (0) | (100) | |||||
| NV | 6 | 5 | 3495 | 52.7 | 47.3 | 98.7 | 1.3 | ||
| NH | 4 | 6 | 4465 | 55.8 | 44.2 | 100.0 | 0.0 | ||
| NJ | 14 | 4 | 2354 | 61.9 | 38.1 | 100.0 | 0.0 | ||
| NM | 5 | 1 | 570 | 56.8 | 43.2 | 98.9 | 1.1 | ||
| NY | 29 | 1 | 486 | 66.7 | 33.3 | 100.0 | 0.0 | ||
| NC | 15 | 33 | 25338 | 51.1 | 48.9 | 99.3 | 0.7 | ||
| ND | 3 | 1* | 405 | 42.0 | 58.0 | 1.4 | 98.6 | ||
| OH | 18 | 9 | 8492 | 49.5 | 50.5 | 25.4 | 74.6 | ||
| OK | 7 | 1 | 5193 | 38.5 | 61.5 | 0.0 | 100.0 | ||
| OR | 7 | 1* | 897 | 59.0 | 41.0 | 100.0 | 0.0 | ||
| PA | 20 | 31 | 25983 | 53.0 | 47.0 | 100.0 | 0.0 | ||
| RI | 4 | 0 | (100) | (0) | |||||
| SC | 9 | 7 | 5270 | 46.6 | 53.4 | 0.0 | 100.0 | ||
| SD | 3 | 1 | 569 | 43.9 | 56.1 | 2.0 | 98.0 | ||
| TN | 11 | 2* | 1407 | 43.6 | 56.4 | 0.0 | 100.0 | ||
| TX | 38 | 12 | 12380 | 49.9 | 50.1 | 40.9 | 59.1 | ||
| UT | 6 | 1 | 880 | 43.2 | 56.8 | 0.3 | 99.7 | ||
| VT | 3 | 1 | 549 | 65.9 | 34.1 | 100.0 | 0.0 | ||
| VA | 13 | 5 | 3879 | 56.4 | 43.6 | 100.0 | 0.0 | ||
| WA | 12 | 1 | 592 | 61.8 | 38.2 | 100.0 | 0.0 | ||
| WV | 5 | 1 | 522 | 39.5 | 60.5 | 0.0 | 100.0 | ||
| WI | 10 | 19 | 13056 | 53.4 | 46.6 | 100.0 | 0.0 | ||
| WY | 3 | 1 | 552 | 34.4 | 65.6 | 0.0 | 100.0 |
* An older poll was used (i.e. no recent polls exist).
Details of the methods are given in the FAQ.
The most recent analysis in this match-up can be found from this page.
