| Obama | Santorum |
| 99.7% probability of winning | 0.3% probability of winning |
| Mean of 329 electoral votes | Mean of 209 electoral votes |
There have been 17 new polls released since my last analysis of the state head-to-head polls with President Barack Obama against Rick Santorum:
| start | end | sample | % | % | % | |||
|---|---|---|---|---|---|---|---|---|
| st | poll | date | date | size | MOE | O | S | diff |
| AZ | Rasmussen | 13-Mar | 13-Mar | 500 | 4.5 | 44 | 45 | S+1 |
| CT | Quinnipiac | 14-Mar | 19-Mar | 1622 | 2.4 | 55 | 35 | O+20 |
| FL | Rasmussen | 13-Mar | 13-Mar | 500 | 4.5 | 45 | 43 | O+2 |
| ME | PPP | 02-Mar | 04-Mar | 1256 | 2.8 | 58 | 35 | O+23 |
| MA | PPP | 16-Mar | 18-Mar | 936 | 3.2 | 61 | 29 | O+32 |
| MO | Rasmussen | 14-Mar | 15-Mar | 500 | 4.5 | 42 | 51 | S+9 |
| NE | Rasmussen | 05-Mar | 05-Mar | 500 | 4.5 | 37 | 49 | S+12 |
| NH | ARG | 15-Mar | 18-Mar | 557 | 4.2 | 48 | 37 | O+11 |
| NJ | Fairleigh Dickinson U | 05-Mar | 11-Mar | 800 | 3.5 | 54 | 33 | O+21 |
| NM | Rasmussen | 14-Feb | 14-Feb | 500 | 4.5 | 55 | 37 | O+18 |
| NY | Siena | 26-Feb | 29-Feb | 808 | 3.4 | 64 | 30 | O+34 |
| NC | PPP | 08-Mar | 11-Mar | 804 | 3.5 | 49 | 44 | O+5 |
| OR | SurveyUSA | 14-Mar | 19-Mar | 1615 | 2.5 | 49.3 | 39.5 | O+9.8 |
| PA | PPP | 08-Mar | 12-Mar | 564 | 4.1 | 48 | 46 | O+2 |
| PA | Quinnipiac | 07-Mar | 12-Mar | 1256 | 2.8 | 45 | 44 | O+1 |
| VA | PPP | 20-Mar | 20-Mar | 500 | 4.5 | 53 | 39 | O+14 |
| VA | Quinnipiac | 13-Mar | 18-Mar | 1034 | 3.1 | 49 | 40 | O+9 |
The most interesting result is that Obama leads in both Pennsylvania polls—that is, in Santorum’s home state. Obama also has a small lead in Florida.
The previous analysis showed President Barack Obama leading Santorum by a mean of 338 to 200 electoral votes, and a 100% probability of winning an election held then.
Today’s Monte Carlo analysis employing 100,000 simulated elections, gives Obama 99,695 wins to Santorum 305 wins (including the 45 ties). Obama receives (on average) 329 to Santorum’s 209 electoral votes. In an election held now, Obama would be expected to win with a 99.7% probability, Santorum would win with a 0.3% probability of winning.
Remarkably, Santorum is doing better against Obama than Mitt Romney was two days ago, where Obama had a 100% probability of winning with a mean of 339 to Romney’s 199 electoral votes.
Here is the distribution of electoral votes [FAQ] from the simulations:
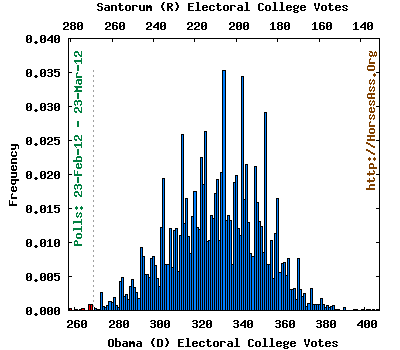
Ten most probable electoral vote outcomes for Obama:
- 332 electoral votes with a 3.53% probability
- 341 electoral votes with a 3.43% probability
- 352 electoral votes with a 2.91% probability
- 323 electoral votes with a 2.63% probability
- 312 electoral votes with a 2.59% probability
- 321 electoral votes with a 2.25% probability
- 343 electoral votes with a 2.15% probability
- 347 electoral votes with a 2.12% probability
- 331 electoral votes with a 2.02% probability
- 338 electoral votes with a 1.99% probability
After 100,000 simulations:
- Obama wins 99.7%, Santorum wins 0.3%.
- Average (SE) EC votes for Obama: 328.8 (21.7)
- Average (SE) EC votes for Santorum: 209.2 (21.7)
- Median (95% CI) EC votes for Obama: 330 (285, 368)
- Median (95% CI) EC votes for Santorum: 208 (170, 253)
Each column of this table shows the electoral vote total aggregated by different criteria for the probability of winning a state (Safe=100%, Strong=90%+, Leans=60%+, Weak=50%+):
| Threshold | Safe | + Strong | + Leans | + Weak |
|---|---|---|---|---|
| Safe Obama | 139 | |||
| Strong Obama | 119 | 258 | ||
| Leans Obama | 83 | 83 | 341 | |
| Weak Obama | 0 | 0 | 0 | 341 |
| Weak Santorum | 11 | 11 | 11 | 197 |
| Leans Santorum | 36 | 36 | 186 | |
| Strong Santorum | 75 | 150 | ||
| Safe Santorum | 75 |
This table summarizes results by state. Click on the poll count to see the individual polls included for the state.
| 0 | 0 | EC | # | Total | % | % | Obama | Santorum | |
|---|---|---|---|---|---|---|---|---|---|
| 4 | 8 | Votes | polls | Votes | Obama | Santorum | % wins | % wins | |
| AL | 9 | 1* | 754 | 37.8 | 62.2 | 0.0 | 100.0 | ||
| AK | 3 | 0* | (0) | (100) | |||||
| AZ | 11 | 1 | 445 | 49.4 | 50.6 | 43.5 | 56.5 | ||
| AR | 6 | 1* | 1744 | 40.4 | 59.6 | 0.0 | 100.0 | ||
| CA | 55 | 1* | 460 | 62.0 | 38.0 | 100.0 | 0.0 | ||
| CO | 9 | 1* | 730 | 51.1 | 48.9 | 65.4 | 34.6 | ||
| CT | 7 | 1 | 1460 | 61.1 | 38.9 | 100.0 | 0.0 | ||
| DE | 3 | 0 | (100) | (0) | |||||
| DC | 3 | 0 | (100) | (0) | |||||
| FL | 29 | 1 | 440 | 51.1 | 48.9 | 63.4 | 36.6 | ||
| GA | 16 | 1 | 1041 | 48.1 | 51.9 | 19.0 | 81.0 | ||
| HI | 4 | 1* | 517 | 64.8 | 35.2 | 100.0 | 0.0 | ||
| ID | 4 | 0* | (0) | (100) | |||||
| IL | 20 | 1* | 546 | 61.5 | 38.5 | 100.0 | 0.0 | ||
| IN | 11 | 0* | (0) | (100) | |||||
| IA | 6 | 1* | 720 | 48.9 | 51.1 | 33.6 | 66.4 | ||
| KS | 6 | 1* | 442 | 45.0 | 55.0 | 7.2 | 92.8 | ||
| KY | 8 | 1* | 528 | 45.5 | 54.5 | 7.4 | 92.6 | ||
| LA | 8 | 1* | 542 | 41.1 | 58.9 | 0.1 | 99.9 | ||
| ME | 4 | 1 | 1168 | 62.3 | 37.7 | 100.0 | 0.0 | ||
| MD | 10 | 0 | (100) | (0) | |||||
| MA | 11 | 2 | 1332 | 69.0 | 31.0 | 100.0 | 0.0 | ||
| MI | 16 | 1* | 2645 | 65.5 | 34.5 | 100.0 | 0.0 | ||
| MN | 10 | 1* | 461 | 57.5 | 42.5 | 98.8 | 1.2 | ||
| MS | 6 | 1* | 717 | 40.0 | 60.0 | 0.0 | 100.0 | ||
| MO | 10 | 1 | 465 | 45.2 | 54.8 | 6.9 | 93.1 | ||
| MT | 3 | 1* | 430 | 47.7 | 52.3 | 25.0 | 75.0 | ||
| NE | 2 | 1 | 430 | 43.0 | 57.0 | 2.3 | 97.7 | ||
| NE1 | 1 | 0 | (0) | (100) | |||||
| NE2 | 1 | 0 | (0) | (100) | |||||
| NE3 | 1 | 0 | (0) | (100) | |||||
| NV | 6 | 1 | 440 | 59.1 | 40.9 | 99.7 | 0.3 | ||
| NH | 4 | 1 | 473 | 56.4 | 43.6 | 97.8 | 2.2 | ||
| NJ | 14 | 2 | 1897 | 61.0 | 39.0 | 100.0 | 0.0 | ||
| NM | 5 | 1* | 460 | 59.8 | 40.2 | 99.8 | 0.2 | ||
| NY | 29 | 1 | 759 | 68.1 | 31.9 | 100.0 | 0.0 | ||
| NC | 15 | 1 | 748 | 52.7 | 47.3 | 84.8 | 15.2 | ||
| ND | 3 | 0 | (0) | (100) | |||||
| OH | 18 | 1 | 1293 | 58.2 | 41.8 | 100.0 | 0.0 | ||
| OK | 7 | 0 | (0) | (100) | |||||
| OR | 7 | 1 | 1434 | 55.5 | 44.5 | 99.8 | 0.2 | ||
| PA | 20 | 2 | 1648 | 50.7 | 49.3 | 64.9 | 35.1 | ||
| RI | 4 | 0 | (100) | (0) | |||||
| SC | 9 | 0 | (0) | (100) | |||||
| SD | 3 | 1* | 436 | 42.2 | 57.8 | 1.1 | 98.9 | ||
| TN | 11 | 1* | 1206 | 47.5 | 52.5 | 11.3 | 88.7 | ||
| TX | 38 | 1* | 466 | 42.1 | 57.9 | 0.8 | 99.2 | ||
| UT | 6 | 0* | (0) | (100) | |||||
| VT | 3 | 1* | 728 | 65.9 | 34.1 | 100.0 | 0.0 | ||
| VA | 13 | 3 | 2451 | 58.9 | 41.1 | 100.0 | 0.0 | ||
| WA | 12 | 1* | 1163 | 56.5 | 43.5 | 99.9 | 0.1 | ||
| WV | 5 | 0* | (0) | (100) | |||||
| WI | 10 | 2 | 1273 | 51.1 | 48.9 | 72.1 | 27.9 | ||
| WY | 3 | 0 | (0) | (100) |
* An older poll was used (i.e. no recent polls exist).
Details of the methods are given in the FAQ.
